
AI Agent Guide
The AI Agent is RedAmon's autonomous pentesting engine — a LangGraph-based system that reasons about your attack surface, selects security tools, executes exploits, and reports findings, all through a real-time chat interface. This guide walks you through every aspect of using the agent.
Operator guide vs. technical whitepaper. This page is the operator-facing guide — how to use the agent, what the chat surface looks like, what every button does. If you want the architectural deep dive — the Scatter-Gather ReAct (SG-ReAct) pattern, every node of the agent state machine, the four-layer guardrail stack, the fireteam fan-out internals, the EvoGraph attack-chain memory model, the WebSocket event protocol, and an impartial code-verified benchmark against other ai pentesting repos — read the RedAmon Agentic System — Technical Whitepaper. The whitepaper covers every concept this page describes, with sequence diagrams, state schemas, configuration tables, and feature-comparison matrices.
Opening the AI Agent
There are two ways in:
- On the Red Zone, click the "AI Agent" button on the right side of the toolbar. The AI Agent Drawer slides in from the right side of the screen.
- From a graph node — click a node, then Ask agent in the node drawer to start a session already focused on it. See Starting a Session from a Graph Node.
Starting a Session from a Graph Node
Instead of opening the drawer and describing a node by hand, you can launch the agent straight from a node on the graph.
- Click a node to open the Node Drawer.
- Click Ask agent (the robot icon on the Basic Info row).
- A modal asks what you want the agent to do. Type your request and click Start session (or press Ctrl/⌘ + Enter).
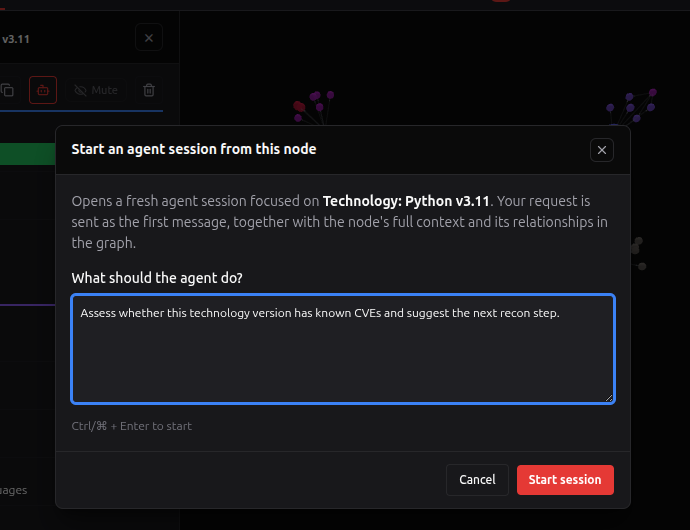
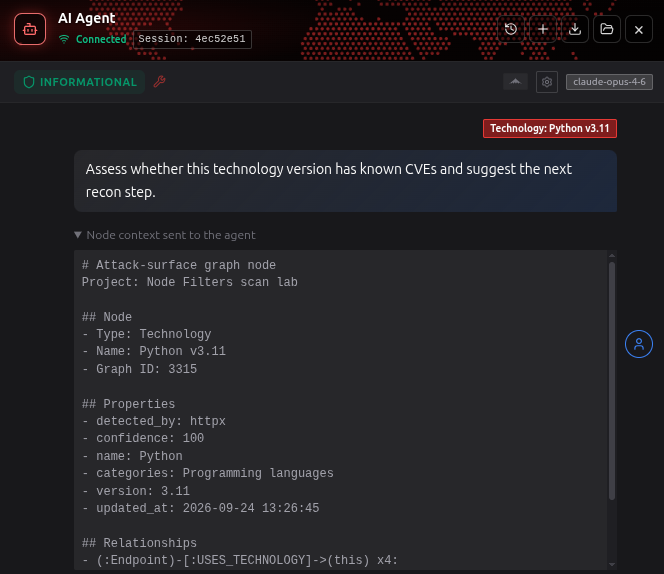
RedAmon then closes the node drawer, opens the AI Agent drawer on a fresh session, and sends your request as the first message — together with the node's full context (its identity, properties and relationships, the same brief as Copy context). You do not have to paste anything.
The agent receives that context, the node's name included, marked as untrusted data rather than as your words: a node's properties can carry text a target controls (a DNS TXT record, a page title) or an external agent wrote, and the triage text an agent can write is left out of it entirely. Only your request is read as an instruction.
In the chat, that first message shows your request under a badge naming the node; the node context itself sits behind a collapsible "Node context sent to the agent" disclosure so the transcript stays readable. The conversation is titled Type: name: your request.
Ask agent is hidden while you view a saved version. The agent always runs against the active graph, so a node from an immutable snapshot cannot start one.
Drawer Layout
The AI Agent drawer contains several sections:
| Area | Description |
|---|---|
| Header | Connection status (WiFi icon), phase badge, attack type, iteration counter, stealth toggle |
| Conversation History | Button to open past conversations panel |
| Chat Area | Scrollable area showing messages, thinking timeline, and tool executions |
| Input Area | Message input with Send/Stop buttons |
Header Elements
| Element | Description |
|---|---|
| Connection Status | Green WiFi icon = connected, red = disconnected. The agent uses a WebSocket connection |
| Phase Badge | Current operational phase: Informational (blue), Exploitation (red), Post-Exploitation (purple) |
| Attack Type | Shows "CVE", "BRUTE", or "PHISH" badge when the agent is executing an attack path |
| Iteration Counter | Current step number in the agent's reasoning loop |
| Stealth Toggle | Enable/disable stealth mode during agent operation |
Sending Messages
Type your message in the input area at the bottom of the drawer.
- Enter — send the message
- Shift + Enter — new line (multiline input)
- The textarea auto-expands as you type
What to Ask
The agent can handle a wide range of queries:
Informational queries (no exploitation):
- "What vulnerabilities exist on 192.168.1.100?"
- "Which technologies have critical CVEs?"
- "Show me all open ports on the subdomains"
- "Find all endpoints with injectable parameters"
- "Summarize the attack surface for this project"
- "What is node 1234, and what is it connected to?" — paste the Node ID from any table's leftmost column (see Node ID and Mute columns); the agent looks it up without needing its type
Exploitation requests:
- "Exploit CVE-2021-41773 on the Apache server"
- "Try brute forcing SSH on 10.0.0.5"
- "Generate a phishing payload for Windows"
- "Create a malicious Word document with a macro"
- "Find and exploit the most critical vulnerability"
- "Test the Node.js deserialization vulnerability"
The agent automatically translates natural language into Neo4j graph queries, tool commands, and exploitation workflows.
Understanding the Timeline
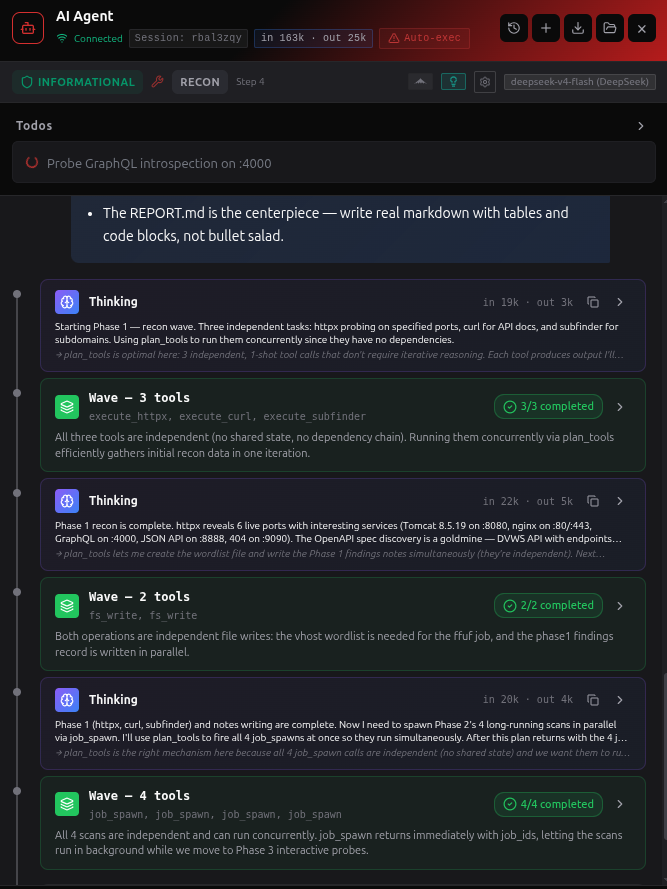
As the agent works, you'll see a timeline of its reasoning and actions:
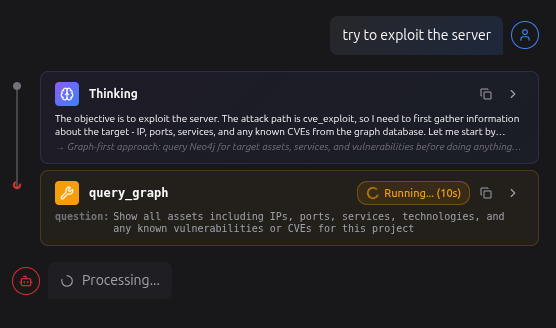
Thinking Cards
Show the agent's internal reasoning — what it's considering, planning, and deciding. These are expandable to see full reasoning details.
Tool Execution Cards
Show when the agent runs a tool. Each card displays:
| Element | Description |
|---|---|
| Tool name | Which tool was executed (e.g., query_graph, execute_nmap, metasploit_console) |
| Arguments | The input sent to the tool |
| Streaming output | Real-time output as the tool runs (updated every 5 seconds for long operations) |
| Analysis | The agent's interpretation of the tool's output |
| Actionable Findings | Key findings extracted from the output |
| Recommended Next Steps | What the agent suggests doing next |
Wave Runner Cards (Parallel Tool Execution)
When the agent identifies two or more independent tools that don't depend on each other's outputs, it groups them into a Wave Runner and executes them in parallel. Wave Runners appear in the timeline as a single grouped PlanWaveCard.
| Element | Description |
|---|---|
| Header | Layers icon, "Wave Runner — N tools" title, list of tool names |
| Status badge | Running (with X/N counter), Success, Partial (some failed), or Error |
| Nested tool cards | Each tool in the Wave Runner rendered as an individual Tool Execution Card inside the group |
| Plan rationale | Why the agent chose to run these tools in parallel |
| Analysis | Combined LLM interpretation of all tool outputs after all tools finish |
| Actionable Findings | Consolidated findings from the Wave Runner analysis |
| Recommended Next Steps | LLM suggestions based on all Wave Runner outputs |
Wave Runners reduce execution time by running independent operations concurrently (e.g., port scanning and graph queries at the same time). The agent automatically decides when to use sequential execution (dependent tools) vs Wave Runner execution (independent tools).
Todo List Widget
The agent maintains a todo list that updates as it works. Items are marked as:
- Pending — not yet started
- In Progress — currently being worked on
- Completed — finished
- Blocked — unable to proceed
Deep Think Cards
Deep Think is always active. The agent performs a structured strategic reasoning step at key decision points before acting. Deep Think cards appear in the timeline with a lightbulb icon.
When it triggers (4 conditions, checked in priority order):
- Start of session — first iteration, to establish an initial attack strategy before any tools are called
- Phase transition — immediately after moving to a new phase (e.g., informational → exploitation), to re-evaluate strategy with the new tool set
- Unproductive streak — when the LLM-classified productivity verdict marks 3 of the last 6 steps as
no_progress/duplicate/blocked. Catches both hard errors AND the "successful-but-useless" loop (HTTP 200 on empty results, identical fuzzing fingerprints, repeated stable 404s) that a keyword-only failure check would miss. (4.15.1) Legitimate debugging is now exempt: a sixth verdict,diagnostic_progress(a changed result/error on a same-approach retry, or a cited ruled-out cause), counts as progress and does not feed the streak; repeat detection keys on(args, output fingerprint)so different payloads with different results are not loops; and the streak prompt asks for one validation step before pivoting rather than forcing an immediate switch. Progress is also churn-aware: growing the recon map (new endpoints / parameters) no longer counts as convergence, so a session that keeps discovering novel-but-useless surface without advancing the actual attack chain (a confirmed finding, credential, or session) will still escalate to Deep Think instead of coasting as "productive". - Self-request — the agent can trigger it on demand by setting
need_deep_think: truewhen it feels stuck, stagnating, or unsure which vector to pursue
What the output contains (6 sections):
| Section | Description |
|---|---|
| Situation | Summary of what is known and where the agent stands |
| Competing Hypotheses | ≥2 candidate explanations for the current evidence, each with supporting_evidence (specific iterations/steps that support it) and disambiguating_probe (ONE concrete test that would tell the alternatives apart). Required when the trigger is "unproductive streak" or when any chain finding has confidence ≥60. This is the anti-confirmation-bias mechanism: forcing the strategist to articulate ≥2 explanations before pivoting prevents locking onto the first plausible-sounding inference. |
| Attack Vectors | All identified attack vectors worth considering |
| Approach | The chosen strategy and rationale for why it is the best path forward, including which hypothesis it tests and how the chosen probe would falsify the alternatives |
| Priority | Ordered list of next action steps (shown as arrows: step 1 → step 2 → step 3) |
| Risks | What could go wrong and how to mitigate it |
The analysis is injected into the agent's system prompt and guides all subsequent reasoning steps — the agent follows the plan unless new information invalidates it. The Competing Hypotheses block leads the next iteration's prompt, pushing the agent toward a disambiguating probe rather than a confirming one.
Self-request mechanism: The agent continuously evaluates its own progress. If it detects stagnation (repeating similar tools without new results, hitting a wall after multiple approaches, or facing too many options with no clear winner), it sets an internal flag that triggers a deep strategic re-evaluation on the very next iteration.
Performance impact: Each trigger adds approximately one extra LLM call. For a typical session this means 1–3 additional calls (start + phase transition + occasional failure recovery). Recommended for complex targets with multiple services where strategic planning pays off.
UI: Deep Think cards show a compact preview (the Situation line) when collapsed. Expand to see all sections. A copy button lets you copy the full analysis to clipboard.
Exploit-Path Search Cards
Exploit-Path Search (LATS) is an optional, systematic tree search over exploit probes. It is a sibling of Deep Think: where Deep Think re-strategizes once and hands a plan back to the linear loop, Exploit-Path Search turns exploitation into an explicit tree, fanning out the competing attack paths, running the most promising one, scoring how close each probe got to a foothold, and backing out of WAF / 403 dead ends instead of grinding them. It is off by default and, when enabled, engages only during exploitation when the agent finds two or more credible attack paths on a discovered surface.
When a search is active, a single Exploit-Path Search card appears in the drawer and mutates in place as the search runs. It shows a running badge, the phase, a rollout counter, an "observe-only" badge in shadow mode, and the final outcome when it ends; a heads-up row (probes / depth / node total against their budgets); the tree as a compact indented outline with a glyph per node status (· queued, ○ running, ◉ scored, ✗ pruned, ⚑ foothold, and a ! marking a dangerous probe that will prompt for confirmation); and the current best line pinned at the bottom. An Expand tree button opens a central modal with the full search as an interactive graph, a per-node inspector (the exact probe, its score breakdown, and why the search chose it over its sibling), and a replay slider to step through how the search unfolded.
By default the search runs in shadow mode (it builds and visualizes the tree but the normal agent still drives the probes), so you can watch what it would do before letting it drive. Every dangerous probe it proposes still goes through the standard approval prompt.
Full guide: Exploit-Path Search (LATS). Architecture deep dive: the whitepaper chapter.
Diagnostic Annotations in Chain Context
Every executed tool step is tagged with a diagnostic error_class and a duration_ms measurement, surfaced inline in the chain context the agent reads on every iteration:
- execute_curl [3ms, application_5xx_fast]: {'args': '-X POST .../jobs ...'}
- execute_curl [105ms, application_4xx]: {'args': '-s .../robots.txt'}
- execute_curl [77ms, tool_internal_error]: {'args': '-sv .../ 2>&1'}
The seven classes are:
| Class | Meaning |
|---|---|
success | 2xx response, no embedded error |
shell_parser_error | Bash/quoting failure — request never sent |
transport_error | DNS/connection/network failure — request never reached the app |
tool_internal_error | Tool wrapper itself failed (curl returncode, MCP error) |
application_4xx | Server returned 4xx — legitimate semantic rejection |
application_5xx_fast | 5xx in <50ms — parse-time crash, input likely never reached business logic |
application_5xx_normal | 5xx in ≥50ms — application or DB-level error |
The split between 5xx_fast and 5xx_normal is the diagnostic that prevents the LLM from treating "all SQL payloads return 500" as evidence the vector is dead — a fast 5xx means the input never reached SQL execution, so the test is inconclusive, not negative.
Response-Uniformity Anomaly Detector: when 5+ consecutive tool calls in the last 8 produce identical error_class, near-identical response size, AND all complete in under 50ms, a warning block is injected into the next prompt. The signature means the application is short-circuiting input uniformly (parse-time guard, framework validator, malformed request envelope) — NOT that the vulnerability class is exhausted. The warning explicitly instructs the agent: "do not mark the current vector class 'tested' on the basis of these uniform responses — the test result is INCONCLUSIVE, not NEGATIVE."
The Three Phases
The agent operates in three distinct phases, each with different tool access:
Phase 1: Informational (Default)
Color: Blue
The agent gathers intelligence without any offensive actions:
- Queries the Neo4j graph for attack surface data
- Runs web searches for CVE details and exploit PoCs
- Makes HTTP requests with curl to test endpoints
- Scans ports with Naabu, probes HTTP services with httpx
- Runs Nmap for service detection
- Uses Nuclei for vulnerability verification
- Discovers subdomains with subfinder and amass (passive OSINT)
- Finds archived URLs with gau (Wayback Machine, Common Crawl)
- Crawls web targets with katana for endpoint discovery
- Analyzes JavaScript files with jsluice for hidden endpoints and secrets
- Discovers hidden parameters with arjun, fuzzes paths with ffuf
- Uses 50+ Kali tools via kali_shell (nikto, whatweb, testssl, dnsrecon, enum4linux-ng, netexec, etc.)
Available tools: query_graph, web_search, cve_intel, shodan, google_dork, execute_curl, execute_httpx, execute_naabu, execute_nmap, execute_nuclei, execute_wpscan, execute_subfinder, execute_gau, execute_amass, execute_katana, execute_jsluice, execute_arjun, execute_ffuf, execute_playwright, execute_osv_scanner, execute_guarddog, kali_shell, proxy_brain
Phase 2: Exploitation
Color: Red
When the agent identifies a viable attack path, it moves to a phase transition to exploitation. This happens two ways: the agent can request it explicitly, or, when it classifies the objective as a concrete attack skill (RCE, XSS, SQLi, and so on) while still in the informational phase, the transition fires automatically (AUTO_TRANSITION_ON_ATTACK_SKILL) - deciding "this is an RCE engagement" is itself the decision to exploit. Either way, if approval gates are enabled the transition still requires your approval; with gates off (as on isolated lab targets) it proceeds without a click. Prompt exploitation matters because the systematic tree search (Exploit-Path Search) only runs during exploitation, so a faster, well-grounded transition lets it engage sooner instead of stalling in recon.
Additional tools unlocked: execute_code, execute_hydra, metasploit_console, msf_restart (proxy_brain's active sends — redamon.replay/fuzz/batch — also unlock here)
Three classified attack paths + unclassified fallback:
| Attack Path | Badge | Description |
|---|---|---|
| CVE (MSF) | CVE/MSF (orange) | The agent finds a matching Metasploit module, configures payload (reverse/bind shell), and fires the exploit |
| Hydra Credential Testing | BRUTE (purple) | Uses THC Hydra to test credentials on 50+ protocols (SSH, FTP, RDP, SMB, MySQL, HTTP forms, etc.) |
| Social Engineering Simulation | PHISH (pink) | Generates malicious payloads, documents, or delivery links for human targets. Supports msfvenom, Office macros, PDF, web delivery, HTA, and email sending |
| Unclassified Fallback | grey | For techniques that don't match the above (e.g., SQL injection, XSS, SSRF). Uses available tools generically |
When an exploit succeeds, the agent records a ChainFinding(exploit_success) in the EvoGraph — recording the attack type, target IP, CVE IDs, module used, payload, and credentials discovered. This finding is linked to the attack chain step and bridged to the recon graph, making it queryable across sessions.
Social Engineering Simulation Attack Path
The phishing attack path targets human factors rather than software vulnerabilities. Instead of firing an exploit directly, the agent generates a weaponized artifact and delivers it to the target — a person must execute it for the attack to succeed.
6-Step Workflow:
- Determine target platform & delivery method — Windows/Linux/macOS/Android + standalone payload, malicious document, web delivery, or HTA delivery
- Set up handler —
exploit/multi/handlerwith matching payload, runs in background - Generate payload/document — msfvenom (exe/elf/apk/ps1/war/vba), Metasploit fileformat modules (Word/Excel/PDF/RTF/LNK), web_delivery (one-liner), or HTA server (URL)
- Verify generation — confirm file exists, job is running
- Deliver — chat download (
docker cp), email via Python smtplib, or web link - Wait for callback — check
sessions -l, transition to post-exploitation
Four generation methods:
| Method | Tool | Output | Delivery |
|---|---|---|---|
| A) Standalone Payload | msfvenom via kali_shell | Binary/script file (exe, elf, apk, ps1, etc.) | File download or email attachment |
| B) Malicious Document | Metasploit fileformat modules | Weaponized Word/Excel/PDF/RTF/LNK | File download or email attachment |
| C) Web Delivery | exploit/multi/script/web_delivery | One-liner command (Python/PHP/PSH/Regsvr32) | Paste command in target's terminal |
| D) HTA Delivery | exploit/windows/misc/hta_server | URL serving an HTA payload | Target visits URL in browser |
Email delivery uses execute_code with Python smtplib to send payloads as email attachments. SMTP settings (host, port, credentials) are configured in the project's Agent Skills tab. If no SMTP is configured, the agent asks the user at runtime.
The phishing path shares the same post-exploitation framework as CVE exploits — once a session opens, the agent transitions to post_exploitation with full Meterpreter interactive commands.
Deep dive: For the full payload matrix, all Metasploit fileformat modules, AV evasion techniques, SMTP configuration, troubleshooting, and example scenarios, see the Agent Skills > Social Engineering Simulation page.
Reverse Shells on the Same LAN (No Tunnel)
When your target is on the same local network as RedAmon (a typical internal pentest), you do not need a tunnel. The catch is which IP to use as LHOST: the agent's tools run inside the kali-sandbox container on a private 172.x Docker network that the target cannot reach, so the address a target must connect back to is your host machine's LAN IP (e.g. your Kali VM's 192.168.x.x). RedAmon forwards port 4444 from the host into the sandbox, so a reverse shell arrives at host-LAN-IP:4444 and is handed to the listener inside the container.
RedAmon detects your host's LAN IP automatically and offers it for you:
- In the settings UI — the LHOST field shows a "Detected (default route): 192.168.x.x — Use this" one-click fill (Agent Behaviour tab, and the in-graph Agent settings drawer).
- In chat — when LHOST is unset, the agent proposes the detected IP instead of guessing the unreachable
172.xaddress.
If the default-route interface is not the one that reaches the target (for example you reach an internal target over a VPN), override detection by setting HOST_LAN_IP=<ip> in your .env and running ./redamon.sh up. Detection is never persisted, so it re-detects whenever you change networks.
Note: this covers reverse shells and outbound tooling. Attacks where the target must connect back on other ports (NTLM relay / coercion on 445/80/389) are not yet supported on the default bridge network and are tracked separately.
Tunnel Providers (Reverse Shells over NAT)
If your attacker machine is behind NAT or in a cloud environment, you can route reverse shell traffic through a TCP tunnel instead of manually configuring LHOST/LPORT. RedAmon supports two tunnel providers:
Option 1: ngrok (Single Port — Free, No VPS)
Best for quick testing. Only tunnels port 4444 (handler). Web delivery / HTA attacks are not supported. Stageless payloads required.
- Create a free account at ngrok.com and complete identity verification (required for TCP tunnels)
- In the webapp, go to Global Settings → Tunneling and paste your authtoken into the ngrok Authtoken field. Click Save Settings.
- Restart kali-sandbox:
docker compose up -d kali-sandbox - In project settings, set Tunnel Provider to "ngrok"
When enabled, ngrok starts automatically inside the kali-sandbox container and exposes a public TCP endpoint (e.g., tcp://7.tcp.eu.ngrok.io:12345). The agent auto-detects the public host and port from the ngrok API — LHOST and LPORT fields are hidden in the UI since they're no longer needed.
Option 2: Chisel (Multi-Port — Requires VPS)
Best for full attack path support including web delivery and HTA delivery. Tunnels both port 4444 (handler) and port 8080 (web delivery/HTA server). Both staged and stageless payloads work.
Prerequisites: A VPS with a public IP. Any cloud provider works — AWS, Azure, DigitalOcean, Linode, Vultr, etc. See VPS Setup Guides below for step-by-step instructions.
Quick setup (if you already have a VPS):
-
Install and start chisel server on your VPS:
curl https://i.jpillora.com/chisel! | bash
chisel server -p 9090 --reverse --auth user:pass
Firewall: Ensure ports 9090 (chisel control), 4444 (handler), and 8080 (web delivery) are open.
-
In the webapp, go to Global Settings → Tunneling and enter your Chisel Server URL (e.g.,
http://your-vps-ip:9090) and Chisel Auth credentials (e.g.,user:pass). Click Save Settings. -
Restart kali-sandbox:
docker compose up -d kali-sandbox -
In project settings, set Tunnel Provider to "chisel"
When enabled, the chisel client starts automatically inside kali-sandbox and creates reverse tunnels:
Victim --> your-vps:4444 --> chisel tunnel --> kali-sandbox:4444 (Metasploit handler)
Victim --> your-vps:8080 --> chisel tunnel --> kali-sandbox:8080 (web delivery / HTA server)
The chisel client auto-reconnects with exponential backoff if the VPS connection drops.
VPS Setup for Chisel
Choose your cloud provider below. The goal is the same for every provider: create a small Linux VM with a public IP, open three TCP ports, install chisel, and run it as a server.
AWS (EC2)
Step 1 — Create a Security Group
-
Go to EC2 → Security Groups → Create security group
-
Name:
chisel-tunnel -
Add Inbound rules:
Type Port Range Source Description Custom TCP 9090 0.0.0.0/0 chisel control channel Custom TCP 4444 0.0.0.0/0 Metasploit handler (reverse shell) Custom TCP 8080 0.0.0.0/0 Web delivery / HTA server SSH 22 My IP SSH access -
Click Create security group
Tip: For production pentests, restrict the source IPs to your target's IP range and your own IP instead of
0.0.0.0/0.
Step 2 — Launch an EC2 Instance
- Go to EC2 → Launch instance
- Name:
chisel-tunnel - AMI: Ubuntu Server 24.04 LTS (or Amazon Linux 2023)
- Instance type:
t2.microort3.micro(free tier eligible — chisel uses minimal resources) - Key pair: Select an existing key pair or create a new one (you'll need it to SSH in)
- Network settings: Select the
chisel-tunnelsecurity group you created - Click Launch instance
- Note the Public IPv4 address (e.g.,
54.xx.xx.xx) from the instance details
Tip: Allocate an Elastic IP and associate it with the instance so the IP doesn't change when you stop/start the VM. Go to EC2 → Elastic IPs → Allocate → Associate.
Step 3 — Install and Start chisel
# SSH into your EC2 instance
ssh -i your-key.pem ubuntu@54.xx.xx.xx

# Install chisel
curl https://i.jpillora.com/chisel! | bash

# Start chisel server (foreground — for testing)
chisel server -p 9090 --reverse --auth user:pass

# Or run as a persistent background service
nohup chisel server -p 9090 --reverse --auth user:pass > /var/log/chisel.log 2>&1 &
Step 4 — Configure RedAmon
In the webapp, go to Global Settings → Tunneling and set:
- Chisel Server URL:
http://54.xx.xx.xx:9090 - Chisel Auth:
user:pass
Click Save Settings, then restart kali-sandbox:
docker compose up -d kali-sandbox
docker compose logs kali-sandbox | grep chisel
# Expected: "[*] chisel started (tunneling ports 4444 + 8080 to VPS)"
Cost: A t2.micro is free tier eligible for 12 months. After that, ~$8/month (or ~$3/month with a reserved instance). You can stop the instance when not pentesting to avoid charges.
Azure (Virtual Machine)
Step 1 — Create a Network Security Group (NSG)
-
Go to Portal → Network security groups → Create
-
Name:
chisel-tunnel-nsg -
Region: Choose the closest region to your targets
-
Click Create, then open the new NSG and go to Inbound security rules → Add
-
Add three rules:
Priority Name Port Protocol Source Action 100 chisel-control 9090 TCP Any Allow 110 msf-handler 4444 TCP Any Allow 120 web-delivery 8080 TCP Any Allow
SSH (port 22) is allowed by default in Azure VMs. You can restrict its source to your IP for security.
Step 2 — Create a Virtual Machine
- Go to Portal → Virtual machines → Create → Azure virtual machine
- Basics tab:
- Name:
chisel-tunnel - Region: Same as your NSG
- Image: Ubuntu Server 24.04 LTS
- Size:
Standard_B1s(~$3.80/month — 1 vCPU, 1 GB RAM, more than enough) - Authentication: SSH public key (recommended) or password
- Username:
azureuser(default)
- Name:
- Networking tab:
- NIC network security group: Advanced → Select
chisel-tunnel-nsg - Public IP: Create new (or use an existing static IP)
- NIC network security group: Advanced → Select
- Click Review + create → Create
- Note the Public IP address from the VM overview page
Tip: Use a Static public IP so it doesn't change. When creating the public IP, set Assignment to Static.
Step 3 — Install and Start chisel
# SSH into your Azure VM
ssh azureuser@20.xx.xx.xx

# Install chisel
curl https://i.jpillora.com/chisel! | bash

# Start chisel server (foreground — for testing)
chisel server -p 9090 --reverse --auth user:pass

# Or run as a persistent background service
nohup chisel server -p 9090 --reverse --auth user:pass > /var/log/chisel.log 2>&1 &
Step 4 — Configure RedAmon
In the webapp, go to Global Settings → Tunneling and set:
- Chisel Server URL:
http://20.xx.xx.xx:9090 - Chisel Auth:
user:pass
Click Save Settings, then restart kali-sandbox:
docker compose up -d kali-sandbox
docker compose logs kali-sandbox | grep chisel
# Expected: "[*] chisel started (tunneling ports 4444 + 8080 to VPS)"
Cost: Standard_B1s costs ~$3.80/month. You can deallocate the VM when not pentesting (you only pay for disk storage when stopped, ~$0.40/month for a 30 GB disk).
Running chisel as a systemd Service (Optional)
For both AWS and Azure, you can run chisel as a persistent systemd service that auto-starts on boot:
sudo tee /etc/systemd/system/chisel.service > /dev/null <<'EOF'
[Unit]
Description=chisel reverse tunnel server
After=network.target

[Service]
ExecStart=/usr/local/bin/chisel server -p 9090 --reverse --auth user:pass
Restart=always
RestartSec=5
StandardOutput=journal
StandardError=journal

[Install]
WantedBy=multi-user.target
EOF

sudo systemctl daemon-reload
sudo systemctl enable chisel
sudo systemctl start chisel

# Check status
sudo systemctl status chisel
sudo journalctl -u chisel -f   # live logs
This ensures chisel survives reboots and restarts automatically if it crashes.
Verify the Connection
After configuring Global Settings → Tunneling and restarting kali-sandbox, verify the tunnel is working:
# 1. Check kali-sandbox logs
docker compose logs kali-sandbox | grep chisel
# Expected: "[*] chisel started (tunneling ports 4444 + 8080 to VPS)"

# 2. From another machine, test that the VPS ports are reachable
nc -zv your-vps-ip 4444    # should connect
nc -zv your-vps-ip 8080    # should connect

# 3. Check chisel client logs inside kali-sandbox
docker compose exec kali-sandbox cat /var/log/chisel.log
# Expected: "client: Connected" or "client: Fingerprint ..."
Phase 3: Post-Exploitation
Color: Purple
After a successful exploit, the agent can transition to post-exploitation (if enabled in project settings):
- Statefull mode — interactive Meterpreter commands: enumeration, lateral movement, data exfiltration
- Stateless mode — re-runs exploits with different command payloads
Agent Tools Reference
The agent has access to 33 built-in tools out of the box, each designed for a specific purpose. Tools are gated by the current operational phase -- configured in the dedicated Tool Matrix tab of the project settings (see Tool Phase Restrictions).
Adding more tools: beyond the 33 built-ins documented below, you can plug any Model-Context-Protocol (MCP) server into the agent as a tool plugin — Shodan, GitHub, Censys, Hugging Face, your own internal MCPs, and 35+ pre-vetted presets. They auto-appear in this section's Tool Matrix and in the agent's system prompt within ~1 second of save. See MCP Tool Plugins for the full operator manual.
Workspace tools (29 more): the agent also gets 24 filesystem tools (
fs_read,fs_write,fs_edit,fs_grep,fs_glob,fs_diff,fs_archive, …) and 5 background-job tools (job_spawn,job_status,job_wait,job_cancel,job_list) for working with the per-project workspace. They're available in all three phases. The drawer side of the same feature — drag-and-drop uploads, file previews, job status badges, log viewing — lives behind the folder icon in the graph toolbar and in the AI Agent drawer header. See Agent Workspace for the full reference.
query_graph
Purpose: Query the Neo4j graph database using natural language.
This is the agent's primary source of truth for all reconnaissance data. The graph contains assets (domains, subdomains, IPs, ports, services), web data (endpoints, parameters, certificates, headers), intelligence (technologies, vulnerabilities, CVEs, MITRE CWE/CAPEC), GitHub secrets, Secret Multiscanner findings (queryable by source and by validation_status, so the agent can isolate credentials confirmed live), and exploit results.
The agent should always check the graph first before reaching for other tools.
Phases: Informational, Exploitation, Post-Exploitation
web_search
Purpose: Search for security research information using the local Knowledge Base (KB) and/or Tavily web search.
The agent calls web_search when it needs external context not in the graph -- CVE details, exploit PoCs, version-specific vulnerabilities, Metasploit module documentation, security advisories, or attack techniques.
How it works: The tool queries the local Knowledge Base first (FAISS vector index + Neo4j fulltext search over curated security datasets like GTFOBins, LOLBAS, NVD, ExploitDB, OWASP, Nuclei). If the KB returns high-confidence results (score >= 0.35), Tavily is skipped. If confidence is low, KB and Tavily results are merged. If the KB is not available, it falls back to Tavily-only. See the Knowledge Base & Web Search wiki page for details on the query pipeline, data sources, ingestion workflows, and CPU/GPU/API embedding options.
Requires: Tavily API key (configured in Global Settings) for web fallback. KB works without any external API keys.
KB-specific parameters: include_sources, exclude_sources, top_k, min_cvss -- allow the agent to target specific KB sources or filter by CVSS severity.
Phases: Informational, Exploitation, Post-Exploitation
cve_intel
Purpose: Structured CVE intelligence — exploitability scores, KEV status, public PoC links, Nuclei template availability.
The agent calls cve_intel when it needs structured CVE answers that semantic search can't give: numeric scores (CVSS, EPSS), boolean flags (is_kev, is_template, is_poc), or compound filtered queries (e.g. "critical CVEs in confluence with EPSS > 0.5 and a Nuclei template"). It wraps the ProjectDiscovery vulnx CLI, which aggregates NVD + CISA KEV + EPSS + HackerOne + public GitHub PoCs + Nuclei templates + CPE mappings into a single dataset (refreshed every ~6 hours).
Subcommands: id CVE-X (single CVE) | search "lucene query" (multi-CVE) | filters (list all 69 searchable fields) | analyze --field X (aggregations) | healthcheck. Always pass --json --limit N; for multi-record search add --fields cve_id,severity,epss_score,is_kev,is_template to slash token usage.
Lucene filters: severity:critical, cvss_score:>7, epss_score:>0.5, is_kev:true, is_template:true, is_poc:true, vendor:apache, product:confluence, age_in_days:<30, vstatus:confirmed, plus 60+ more. Combine with AND / OR / NOT, ranges, wildcards, parens.
Requires: Nothing — works fully without an API key (anonymous mode: 10 req/min). Optional PDCP API key lifts the rate limit and is silently injected at call time (LLM never sees it).
Composes well with: query_graph (find CVEs in scope) → cve_intel (rank by exploitability) → execute_nuclei (verify the high-leverage candidates).
Phases: Informational, Exploitation, Post-Exploitation. Not dangerous (no confirmation prompt). No RoE category (passive — sends no traffic to the target). Stealth mode: NO RESTRICTIONS.
See the dedicated CVE Intel wiki page for the full filter catalog, query patterns, and integration details.
shodan
Purpose: Internet-wide OSINT via the Shodan API.
Query Shodan for host information, open ports, banners, technologies, and vulnerabilities on internet-facing targets. Supports host lookup, search queries, DNS resolution, and result counting — useful for passive reconnaissance without sending any packets to the target.
Requires: Shodan API key (configured in Global Settings).
Phases: Informational, Exploitation
google_dork
Purpose: Google dorking OSINT via SerpAPI.
Perform targeted Google search queries using advanced operators (site:, inurl:, filetype:, intitle:, etc.) to discover exposed files, admin panels, login pages, configuration files, and other sensitive resources indexed by Google.
Requires: SerpAPI key (configured in Global Settings).
Phases: Informational
execute_osv_scanner
Purpose: Verdict a package against the offline OSV database: is it known-malicious (MAL-) or known-vulnerable (CVE / GHSA)?
The agent calls execute_osv_scanner when it has a specific package in hand (from JS Recon, a lockfile in the workspace, or an uploaded SBOM) and wants an authoritative verdict. It accepts one argument: a purl (pkg:npm/lodash@4.17.21, synthesized into a one-component CycloneDX SBOM), a workspace lockfile path (/work/package-lock.json), or an SBOM path (/work/bom.cdx.json). It returns a compact [DATA] summary listing malicious and vulnerable packages. A MAL- id is a terminal malicious verdict; CVE- / GHSA- are known-vulnerable.
Requires: the offline OSV database, populated once with ./redamon.sh supply-chain-sync npm.
Composes well with: query_graph (find Package nodes in scope) → execute_osv_scanner (verdict a specific purl) → execute_guarddog (behavioural second opinion on a flagged package).
Phases: Informational, Exploitation, Post-Exploitation. Not dangerous (passive, fully offline, sends no traffic to the target and makes no internet call). Stealth mode: NO RESTRICTIONS.
execute_guarddog
Purpose: Behavioural malware analysis of one named package: does it behave like malware (install hooks, obfuscation, exfil, typosquat)?
The agent calls execute_guarddog for a second opinion on a suspicious package, especially one OSV does not flag. The argument is "<ecosystem> <name> [version]", where ecosystem ∈ {npm, pypi, go, crates, rubygems, github_action, extension}. A hit is suspicious, never a terminal malicious verdict (only an OSV MAL- id is malicious).
DANGEROUS: GuardDog downloads the attacker-authored package tarball. The tool never unpacks anything in the Kali sandbox; it dispatches to a hardened analyzer container (cap_drop=ALL, read-only rootfs, non-root, resource caps, no secrets). It still triggers an approval prompt when confirmation gates are enabled.
Requires: the offline OSV database (./redamon.sh supply-chain-sync npm) and the built analyzer image.
Phases: Informational, Exploitation. Dangerous (confirmation prompt). Stealth mode: RESTRICTED (it fetches a package from a public registry).
See the Supply-Chain Scanning wiki page for how these two tools relate to the standalone Supply Chain scan and the recon-pipeline harvest, and for the OSV database setup.
execute_curl
Purpose: Make HTTP requests to targets.
Primary use is reachability checks (status codes, headers). Fallback use is vulnerability probing (path traversal, LFI/RFI, header injection, SSRF) when the graph has no relevant vulnerability findings for the target.
Phases: Informational, Exploitation, Post-Exploitation
execute_naabu
Purpose: Fast port scanning.
Use only to verify that specific ports are actually open or to scan new targets not yet in the graph. For most cases, port data is already available via query_graph.
Phases: Informational, Exploitation
execute_nmap
Purpose: Deep network scanning with service detection, OS fingerprinting, and NSE scripts.
Use when detailed service analysis is needed (-sV for version detection, -O for OS fingerprinting, -sC for default scripts, --script vuln for vulnerability scripts). Slower than Naabu but much more detailed.
Phases: Informational, Exploitation, Post-Exploitation
execute_nuclei
Purpose: Template-based CVE verification and exploitation.
YAML-based vulnerability scanner with 9,000+ community templates. Primary use is verifying if a target is vulnerable to a specific CVE. Secondary use is detecting vulnerabilities by category (rce, sqli, xss, lfi, etc.). Can verify and exploit many CVEs in a single step.
Phases: Informational, Exploitation
execute_httpx
Purpose: HTTP probing and fingerprinting.
Probe HTTP services for status codes, page titles, server headers, technology detection, content length, and redirect chains. Useful for quickly fingerprinting web services across many targets or verifying specific endpoints.
Phases: Informational, Exploitation
execute_subfinder
Purpose: Passive subdomain enumeration via OSINT sources.
Discovers subdomains from certificate transparency logs, DNS datasets, and search engine APIs. Purely passive -- sends no traffic to the target. Use -all for maximum source coverage and -json -silent for structured output.
Phases: Informational, Exploitation
execute_gau
Purpose: Passive URL discovery from web archive sources.
Fetches known URLs from Wayback Machine, Common Crawl, AlienVault OTX, and URLScan. Purely passive -- all data comes from third-party archives, no traffic to the target. Use --subs to include subdomains, --json for structured output, and --blacklist png,jpg,gif,css,woff to filter static assets.
Optional: URLScan API key (configured in Global Settings) enriches results from URLScan archives.
Phases: Informational, Exploitation
execute_jsluice
Purpose: JavaScript static analysis for hidden endpoints and secrets.
Extracts hidden API endpoints, URL paths, query parameters, and secrets (AWS keys, API tokens, credentials) from downloaded JavaScript files. Local file analysis only -- download JS files first via execute_curl, then analyze with jsluice.
Phases: Informational, Exploitation
execute_katana
Purpose: Web crawling and endpoint/URL discovery.
Crawls web targets to discover URLs, endpoints, JS-linked paths, and known files (robots.txt, sitemap.xml). JavaScript parsing (-jc) finds endpoints hidden in JS bundles. Use -jsonl for JSON output with status codes and metadata.
Phases: Informational, Exploitation
execute_amass
Purpose: OWASP Amass subdomain enumeration and network mapping.
Comprehensive subdomain discovery with passive mode (OSINT-only, no target traffic) and active mode (DNS brute-force, zone transfers). Use enum -passive -d DOMAIN for passive-only enumeration and enum -d DOMAIN -timeout 10 for full active mode.
Phases: Informational, Exploitation
execute_arjun
Purpose: HTTP parameter discovery.
Brute-forces ~25,000 common parameter names against a URL to discover hidden GET, POST, JSON, and XML parameters. Inherently noisy (sends thousands of requests). Forbidden in stealth mode.
Phases: Informational, Exploitation
execute_ffuf
Purpose: Web fuzzing for hidden directories, files, virtual hosts, and parameters.
Fast web fuzzer using the FUZZ keyword for injection points in URLs, headers, and POST data. Uses wordlists from /usr/share/seclists/. Inherently noisy. Forbidden in stealth mode.
Phases: Informational, Exploitation
execute_wpscan
Purpose: WordPress vulnerability scanning.
Detects vulnerable plugins, themes, users, and misconfigurations on WordPress sites. Optional WPScan API token (configured in Global Settings) enriches results with vulnerability database data.
Phases: Informational, Exploitation
kali_shell
Purpose: General shell execution in the Kali Linux sandbox.
Full bash shell access with 70+ Kali tools organized by category:
- Exploitation: msfvenom, searchsploit, sqlmap, dalfox (XSS), kxss (per-param XSS reflection), interactsh-client (blind OOB callbacks), sstimap (SSTI: Jinja2/Twig/Freemarker/Velocity/Mako/Tornado/Pebble), tplmap (SSTI complement: Smarty + extra Velocity), ysoserial (Java deserialization gadget chains), phpggc (PHP unserialize/PHAR gadgets)
- Password cracking: hashcat (modes 18200 AS-REP / 13100 Kerberoast / 1000 NTLM / 22 bcrypt), john, hashid (hash identification), cewl (wordlist from target site)
- Web/infra scanning: nikto (web server misconfigs), whatweb (tech fingerprinting), testssl (SSL/TLS audit), commix (command injection)
- DNS / subdomain takeover: dig, nslookup, host, dnsrecon (zone transfers, SRV, DNSSEC walk), dnsx (fast bulk DNS), subzy (90+ provider takeover signatures)
- Windows / Active Directory: smbclient, sshpass, enum4linux-ng, netexec/nxc (SMB / WinRM / LDAP / MSSQL / RDP, with
--pass-poland--continue-on-success), kerbrute (pre-auth user enum + spray), bloodhound-python (AD relationship collection), bhgraph (NetworkX path-finder over BloodHound JSON, no Neo4j;path-to-da/kerberoastable/asreproastable/unconstrained/dcsyncers/high-value), certipy-ad (AD-CS ESC1-ESC15), bloodyAD (live AD abuse aligned to BloodHound edges), gMSADumper (ReadGMSAPassword), gpp-decrypt (SYSVOL GPP cpassword), ldapdomaindump, impacket-* (wmiexec, psexec, smbexec, secretsdump, GetNPUsers, GetUserSPNs, ticketer, getST, addcomputer, rbcd, dacledit, ntlmrelayx) - API / GraphQL: jwt_tool (JWT all-tests / alg-confusion / kid-injection / jku-spoofing), graphql-cop, graphqlmap
- Secrets / SAST: betterleaks (git repo secret scanning, gitleaks successor), semgrep (source-aware static analysis:
p/default,p/owasp-top-ten,p/secrets,p/python,p/javascript,p/typescript,p/golang,p/javapacks) - Passive recon: paramspider, gau, amass
- Tunneling: ngrok, chisel
- DoS / stress: hping3, slowhttptest
- Node.js runtime: node + npm (for prototype-pollution gadget testing and any JS exploit POC)
- Python libs available (importable via
python3 -corexecute_code): requests, beautifulsoup4, pycryptodome, PyJWT, paramiko, impacket, pwntools, websockets (CSWSH probes), zeep (SOAP / WS-Security), python3-saml (XSW / Comment Injection / Golden SAML), boto3 (AWS), msal / azure-identity / azure-mgmt-resource (Entra ID + Azure resources), google-auth / google-api-python-client / google-cloud-storage (GCP) - Pre-staged post-exploit toolkits (served to footholds via
python3 -m http.server):/opt/tools/linux/:linpeas.sh(PEASS-ng auditor),LinEnum.sh(rebootuser/LinEnum),pspy64(real-time process snooper, no root),deepce.sh(Docker container-escape primitive scanner)/opt/tools/windows/:winPEASx64.exe(PEASS-ng),PowerUp.ps1(PowerSploit),PrivescCheck.ps1(itm4n)
- General utils: netcat, socat, rlwrap, jq, git, wget, perl, gcc/g++/make
Do not use for tasks that have a dedicated MCP tool (curl, httpx, nmap, naabu, nuclei, jsluice, subfinder, amass, gau, katana, ffuf, arjun, wpscan, hydra, msfconsole, playwright) or for writing multi-line scripts (use execute_code instead).
Timeout: 300 seconds (5 minutes).
Library Installation: Controlled via Agent Behaviour settings. When enabled, the agent may pip install or apt install packages as needed. An authorized packages whitelist and/or forbidden packages blacklist can be configured. See Project Settings Reference > Agent Behavior.
Phases: Informational, Exploitation, Post-Exploitation
execute_code
Purpose: Write and execute multi-line code without shell escaping issues.
Code is passed as a clean string parameter, written to a file, and executed with the appropriate interpreter. This eliminates all shell escaping problems that arise when trying to run complex scripts via kali_shell.
Supported languages: Python (default), Bash, Ruby, Perl, C, C++
Timeout: 120 seconds for execution. Compiled languages (C/C++): 60 seconds compile + 120 seconds run.
Files persist at /tmp/{filename}.{ext} and can be re-run via kali_shell if needed.
Pre-installed Python Libraries
The following libraries are available inside the Kali sandbox — import them directly, no pip install needed:
| Library | Import | Use Case |
|---|---|---|
| requests | import requests | HTTP requests for web exploitation, API interaction, form submission, file upload, session management |
| BeautifulSoup | from bs4 import BeautifulSoup | Parse HTML responses to extract CSRF tokens, hidden form fields, session nonces, page data, and links. Combine with requests to interact with web apps that require parsing before submission |
| PyCryptodome | from Crypto.Cipher import AES | Encrypt/decrypt payloads, hash manipulation, custom crypto attacks, padding oracle, key derivation |
| PyJWT | import jwt | Forge, tamper, and decode JWT tokens. Algorithm confusion attacks (none, HS256, RS256), claim manipulation |
| Paramiko | import paramiko | Programmatic SSH sessions, SFTP file transfer, SSH tunneling, remote command execution for post-exploitation |
| Impacket | from impacket.smbconnection import SMBConnection | Windows/AD attacks: SMB relay, NTLM authentication, Kerberos, secretsdump, psexec, wmiexec, dcomexec |
| pwntools | from pwn import * | Binary exploitation, remote TCP/UDP connections, shellcode generation, struct packing, ROP chain building |
When to Use execute_code
- Multi-line exploit scripts — custom PoC code, deserialization payloads, payload generators
- Web app interaction requiring HTML parsing — fetch a login page, extract a CSRF token with BeautifulSoup, then submit credentials
- JWT manipulation — decode a token, modify claims (e.g., escalate role to admin), re-sign with a known or guessed secret
- Crypto attacks — decrypt intercepted traffic, craft encrypted payloads, exploit weak crypto implementations
- SSH-based post-exploitation — open a Paramiko session to an already-compromised host, enumerate files, exfiltrate data
- Windows/AD exploitation — use Impacket to dump secrets, enumerate shares, or execute commands via psexec/wmiexec
- Binary exploitation — connect to a vulnerable service with pwntools, send crafted payloads, receive shells
Examples
Extract CSRF token and submit login form:
import requests
from bs4 import BeautifulSoup

s = requests.Session()
r = s.get('http://target/login', verify=False)
soup = BeautifulSoup(r.text, 'html.parser')
token = soup.find('input', {'name': 'csrf_token'})['value']
r = s.post('http://target/login', data={
    'csrf_token': token,
    'username': 'admin',
    'password': 'admin'
}, verify=False)
print(r.status_code, r.url)
Forge a JWT token with algorithm confusion:
import jwt

# Decode without verification to inspect claims
token = "eyJhbGciOi..."
claims = jwt.decode(token, options={"verify_signature": False})
print("Original claims:", claims)

# Forge with 'none' algorithm (CVE-2015-9235)
forged = jwt.encode({"user": "admin", "role": "admin"}, "", algorithm="HS256")
print("Forged token:", forged)
Enumerate SMB shares with Impacket:
from impacket.smbconnection import SMBConnection

conn = SMBConnection('10.0.0.5', '10.0.0.5')
conn.login('guest', '')
for share in conn.listShares():
    name = share['shi1_netname'][:-1]
    print(f"Share: {name}")
Connect to a vulnerable service with pwntools:
from pwn import *

r = remote('10.0.0.5', 1337)
r.recvuntil(b'> ')
r.sendline(b'payload')
print(r.recvall(timeout=5).decode())
Phases: Exploitation, Post-Exploitation
execute_hydra
Purpose: Brute force password cracking with THC Hydra.
Fast, parallelized network login cracker supporting 50+ protocols (SSH, FTP, RDP, SMB, VNC, MySQL, MSSQL, PostgreSQL, Redis, MongoDB, HTTP forms, and more). See Hydra Credential Testing for configuration options.
Phases: Exploitation, Post-Exploitation
metasploit_console
Purpose: Execute Metasploit Framework commands.
Full access to the Metasploit console — module context and sessions persist between calls. Use for exploit execution, session management, post-exploitation modules, and payload generation. Chain commands with semicolons (;), not &&.
Phases: Exploitation, Post-Exploitation
msf_restart
Purpose: Restart the Metasploit console.
Resets module context and clears stale state. Use when the console becomes unresponsive or when switching between unrelated exploit workflows.
Phases: Exploitation, Post-Exploitation
Traffic tool: proxy_brain
proxy_brain is the agent's single code-native tool for the captured HTTP
traffic corpus (the HTTP history recorded by the capture proxy). It replaces
the ten former proxy_* tools: the agent writes Python, and a pre-imported SDK,
redamon, is its only door to the traffic. It requires TrafficMind
enabled and is strictly scoped to the current project and user.
Purpose: hunt and exploit over the captured corpus in code: read, search, diff, decode, and (in the exploitation phase) replay, fuzz, and race requests. Anything an interactive web proxy does, the agent composes here.
The SDK, in brief (redamon is pre-imported):
- Read (any phase, tenant-scoped):
search(history rows),get(one full transaction),sitemap,params,grep(body substring),diff(compare two responses),to_curl(PoC),query(allowlisted analytics). - Decode:
decode(base64/url/hex/gzip),jwt(tok).forge(...)(alg:none / weak secret / claim tampering). - Active (exploitation phase only):
replay(id, mutate)(host-pinned resend with fields changed: method/path/query/param/headers/dropHeaders/cookie/body; supports auth-context swaps for IDOR/BOLA),batch(id, muts, parallel=True)(concurrent race window),fuzz(id, param, payloads)(automated payload sweep). - Result:
finding(...),print(...).
The manual. The agent reads its own cookbook from code: redamon.manual() for
the core SDK + capability map, redamon.manual("jwt") for a technique section (20 sections:
recon, intruder, sqli, authz, jwt, race, smuggling, cache, injection, decode,
sequencer, flows, nosql, graphql, lfi, cmdi, cors, xxe, auth, report).
How it runs. proxy_brain executes in the Kali sandbox but holds no database
credential; redamon reaches the corpus through the agent's /traffic/exec (read)
and /traffic/replay (active) endpoints, authenticated by a signed tag the sandbox
cannot forge. Active sends are rebuilt host-pinned to the origin, pass the egress
guard, and are re-captured into TrafficMind.
Phases: all phases for reads/decode; active sends (replay/batch/fuzz) are Exploitation and Post-Exploitation only. DANGEROUS (can emit live traffic, requires confirmation). Stealth mode: RESTRICTED (fuzz/batch/rapid replay held back). Bounded by a per-session send budget.
See the proxy_brain page for the full SDK, the capability map, worked examples, and the practice target.
Agent Container Runtimes
The agent container ships with a full set of language runtimes and development tools. These are available for any agent workload that needs to build, test, or interact with code repositories.
| Runtime | Version | Commands |
|---|---|---|
| Node.js | 20 LTS | node, npm, npx, yarn, pnpm |
| Python | 3.11 | python3, pip |
| Go | 1.22 | go build, go test, go mod |
| Ruby | 3.3 | ruby, gem, bundler |
| Java | OpenJDK 21 | java, javac, mvn |
| PHP | 8.4 | php, composer |
| .NET | SDK 8.0 | dotnet build, dotnet test |
| Build tools | — | make, gcc, g++ |
| Utilities | — | git, ripgrep (rg), jq, curl, wget, unzip, file, ssh |
Approval Workflows
When the agent wants to transition to a more aggressive phase, it pauses and sends an Approval Request.
The approval request includes:
- Reason — why the agent wants to transition
- Planned actions — what it intends to do
- Risks — potential impact
You have three options:
| Action | Description |
|---|---|
| Approve | Allow the phase transition — agent continues with offensive tools |
| Modify | Approve with modifications — add constraints or redirect the approach |
| Abort | Deny the transition — agent stays in the current phase |
Approval gates are configurable per project. You can disable them in the Agent Behaviour tab of project settings to let the agent operate fully autonomously.
Question Requests
Sometimes the agent needs additional information from you. It sends a Question Request with:
- The question text
- Optional predefined answer choices
You can select a predefined answer or type a custom response.
Guidance Messages
You can steer the agent while it's working by sending a guidance message:
- Type your guidance in the input area while the agent is actively processing
- The guidance is injected into the agent's context before its next reasoning step
- Examples: "Focus on SSH vulnerabilities", "Skip the web application, look at network services", "Try a different exploit module"
The agent acknowledges guidance with a confirmation message.
Stop and Resume
Stopping the Agent
Click the Stop button (replaces the Send button while the agent is working) to pause execution. The agent's state is checkpointed.
Resuming
After stopping, a Resume button appears. Click it to continue from the last checkpoint with full context preserved.
Conversation History
The agent supports multiple conversations per project. Each conversation is an independent session with its own context.
Viewing Past Conversations
- Click the history button (clock icon) in the drawer header
- A Conversation History panel slides in showing all past conversations
Each conversation shows:
- Title (auto-generated from the first message; for a session started from a node,
Type: name: your request) - Status (active, completed)
- Agent running indicator
- Current phase
- Iteration count
- Timestamp
Switching Conversations
Click on any conversation to load it. The chat area updates with the full message history.
Deleting Conversations
Click the delete icon on any conversation to remove it permanently.
Starting a New Conversation
Click the "New Conversation" button at the top of the history panel.
Downloading Session Reports
You can export any conversation as a Markdown report:
- Click the download button (download icon) in the drawer header
- The report is saved as a
.mdfile containing:- All user messages and agent responses
- Thinking/reasoning steps
- Tool executions with output
- Findings and recommendations
- Todo list states
Connection Status
The AI Agent uses a WebSocket connection for real-time communication.
| Icon | Status | Meaning |
|---|---|---|
| Green WiFi | Connected | WebSocket is active, agent is reachable |
| Red WiFi (crossed) | Disconnected | Connection lost — messages won't send |
If disconnected, the agent will attempt to reconnect. You can also try refreshing the page.
Tips for Effective Use
- Start with informational queries — ask the agent to summarize the attack surface before requesting exploits
- Be specific — "Exploit CVE-2021-41773 on 10.0.0.5:8080" works better than "hack the server"
- Use guidance — steer the agent if it's going in the wrong direction
- Check the todo list — it shows what the agent is planning and what's done
- Review tool output — expand tool execution cards to see raw output
- Use approval gates — keep them enabled until you're comfortable with the agent's behavior
Agent Configuration
Key settings that control agent behavior (configured in project settings > Agent Behaviour tab):
| Setting | Default | Description |
|---|---|---|
| LLM Model | claude-opus-4-6 | The AI model powering the agent |
| Max Iterations | 100 | Maximum reasoning-action loops |
| Approval for Exploitation | true | Require your approval before exploitation |
| Approval for Post-Exploitation | true | Require your approval before post-exploitation |
| Post-Exploitation Type | statefull | Meterpreter sessions vs. one-shot commands |
| Tool Output Max Chars | 20000 | Truncation limit for tool output |
Full configuration reference: Project Settings Reference > Agent Behavior
Next Steps
- Project Settings Reference — fine-tune every parameter
- AI Model Providers — configure different AI models for the agent
- Fireteam — Parallel Specialists — fan out the agent into N specialist sub-agents on independent angles, with per-member tool approvals and every project parameter explained
- Attack Surface Graph — understand the graph schema the agent queries
- EvoGraph — Attack Chain Evolution — how the agent's actions are tracked as persistent, evolutionary attack chains
- Anatomy of a Think Step — the exact prompt the agent receives and the exact decision JSON it returns: every system-prompt section explained, the human message, and every field of the
LLMDecisionschema, with one full worked step - RedAmon Agentic System — Technical Whitepaper — full architectural reference: SG-ReAct pattern, agent state machine, guardrails, fireteam fan-out, WebSocket protocol, comparative benchmark