
Recon Pipeline Workflow
The Workflow View is an interactive visual representation of the entire reconnaissance pipeline. Instead of navigating through individual settings tabs, you see every module, its data dependencies, and how information flows from target input through discovery, scanning, probing, enumeration, and vulnerability assessment -- all in a single horizontal diagram.
Switching Between Views
The Project Settings form offers two ways to configure the recon pipeline:
- Tab View (default in edit mode) -- the traditional tabbed interface with collapsible sections
- Workflow View (default in create mode) -- the interactive pipeline diagram
Toggle between them using the two small icons at the left edge of the Recon Pipeline tab group. The list icon switches to Tab View; the branch icon switches to Workflow View.
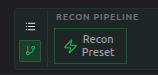
Tip: Both views share the same data. Changes made in the Workflow View are instantly reflected in the Tab View and vice versa -- no re-fetching, no data loss.
Understanding the Diagram
The workflow diagram has three horizontal bands:
| Band | Position | Contents |
|---|---|---|
| Upper data band | Top | Data nodes produced and consumed by tools (Domain, Subdomain, IP, Port, Service, BaseURL, Endpoint, CVE) |
| Tool band | Center | All recon modules arranged left-to-right in pipeline order |
| Lower data band | Bottom | Additional data nodes (DNSRecord, Technology, Certificate, Header, Parameter, Vulnerability, Secret, ExternalDomain, MitreData, Capec) |
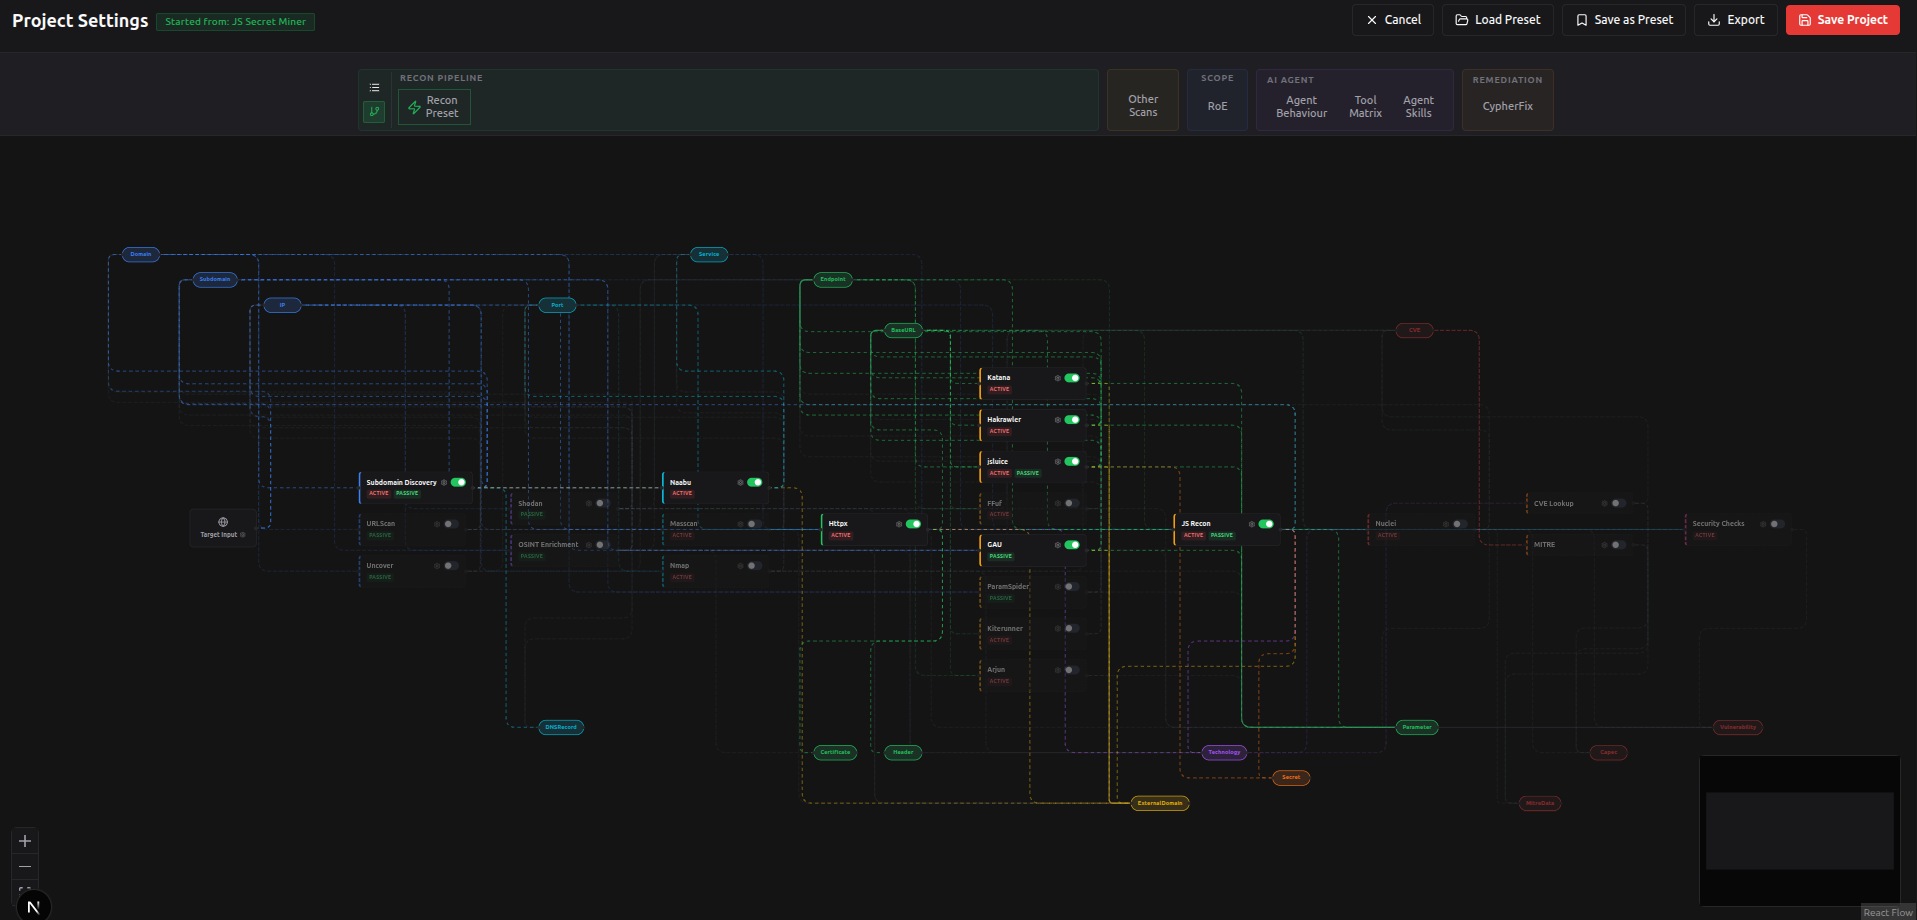
Tool Nodes (Rectangles)
Each tool appears as a compact card showing:
- Tool name (e.g., "Naabu", "Httpx", "Katana")
- Active/Passive badge indicating the tool's scanning mode
- Enable/Disable toggle -- switch a module on or off directly from the graph
- Settings icon -- click to open the full configuration modal
- Left border color matching the pipeline stage (blue for Discovery, cyan for Port Scanning, green for HTTP Probing, etc.)
When a tool is disabled, its card becomes semi-transparent with a dashed border.
Data Nodes (Pills)
Data nodes are small colored pills representing the types of information that flow between tools:
| Category | Data Nodes | Color |
|---|---|---|
| Identity | Domain, Subdomain, IP | Blue |
| Network | DNSRecord, Port, Service | Cyan |
| Web | BaseURL, Endpoint, Parameter, Header, Certificate | Green |
| Technology | Technology | Purple |
| Security | Vulnerability, CVE, MitreData, Capec, Secret | Orange |
| External | ExternalDomain | Yellow |
Each data node shows which tools produce it, enrich it, and consume it. Hover over any data node to see a tooltip listing its producers, enrichers, and consumers.
Edges
There are two types of connections:
Dashed lines (produces/consumes) -- the tool creates new nodes of this type or reads them as input:
- Animated dashes -- data is actively flowing (the connected tool is enabled)
- Static dashes -- the connected tool is disabled or the data node has no active producer
Dotted lines (enriches) -- the tool updates existing nodes with additional properties (e.g. adding geo/ASN data to an IP, or domain age to a Domain) without creating new nodes:
- Animated dots -- enrichment is active (the tool is enabled)
- Static dots -- the tool is disabled
All edges are colored per node type, matching the graph page legend colors (e.g. Domain edges are deep navy, IP edges are teal, Port edges are dark cyan).
Pipeline Stages
The tools are organized into pipeline stages from left to right:
| Stage | Tools | Description |
|---|---|---|
| Input | Target Input | The starting point -- your domain, subdomains, or IPs |
| Discovery | Subdomain Discovery, URLScan, Uncover | Enumerate subdomains, resolve DNS, discover related assets |
| OSINT | Shodan, OSINT Enrichment | Passive intelligence gathering from 7+ sources (Censys, FOFA, OTX, Netlas, VirusTotal, ZoomEye, CriminalIP) |
| Port Scanning | Naabu, Masscan, Nmap | Active port discovery and service version detection |
| HTTP Probing | Httpx | Probe discovered hosts for live HTTP/HTTPS services, detect technologies |
| Resource Enum | Katana, ZAP Ajax Spider, Hakrawler, jsluice, FFuf, GAU, ParamSpider, Kiterunner, Arjun | Crawl, fuzz, and discover endpoints, parameters, and secrets |
| JS Recon | JS Recon | Deep JavaScript analysis -- secrets, endpoints, frameworks, dependency confusion |
| Supply-Chain Recon | Supply-Chain Recon | GROUP 5.5, after JS Recon. Black-box harvest of the npm packages the target serves (source maps + http_probe technologies + retire.js), verdicted offline against the local OSV database for known-malicious (MAL-) and known-vulnerable (CVE / GHSA) packages. Off by default. See Supply-Chain Scanning |
| Vuln Scanning | Nuclei, GraphQL Scan, Subdomain Takeover, VHost & SNI, Web Cache Poisoning | Template-based vulnerability scanning with 9,000+ checks (Nuclei) + GraphQL introspection/misconfig testing + layered subdomain takeover detection + hidden virtual host discovery via L7/L4 probes + active web cache poisoning/deception detection (WCVS breadth + native 5-phase confirmation). All five run in parallel (GROUP 6 Phase A) |
| CVE & MITRE | CVE Lookup, MITRE | Technology-based CVE lookup and MITRE ATT&CK/CWE/CAPEC enrichment |
| Security Checks | Security Checks | 26 security configuration checks (TLS, headers, DNS, auth, exposure) |
Cross-cutting layer — Adversarial AI signal extraction. Independently of the stages above, every Discovery, Port Scanning, HTTP Probing, Resource Enum, and JS Recon tool also runs a thin AI-aware hook that tags AI services (local LLM runtimes, vector DBs, AI frontends, proxies, SDK clients) on the same graph nodes it normally writes. The hooks live inside the existing modules, gated by per-feature toggles. Coverage so far: DNS provider hints (Phase 1), AI port catalog (Phase 2), Nmap runtime regex (Phase 3), HTTP header/title/favicon/Wappalyzer signatures (Phase 4), endpoint AI classifier with
ai_interface_type/is_ai_rag_ingest/prompt-injectable params (Phase 5), and JS Recon AI SDK detection writing five newJsReconFinding.finding_type ai-sdk-*values + Secret enrichment (Phase 6). All hooks produceai_*/is_ai_*properties plusTechnology(category=ai-*)nodes; zero new graph labels. See Adversarial AI Recon for the full breakdown.
Chain Breaking and Alerts
The workflow view makes dependency issues immediately visible. When a tool is enabled but its required input data has no active producer, two things happen:
- The data node turns red with a pulsing animation (starved -- no tool is feeding it)
- The tool node shows an amber warning icon with a detailed tooltip explaining what's missing
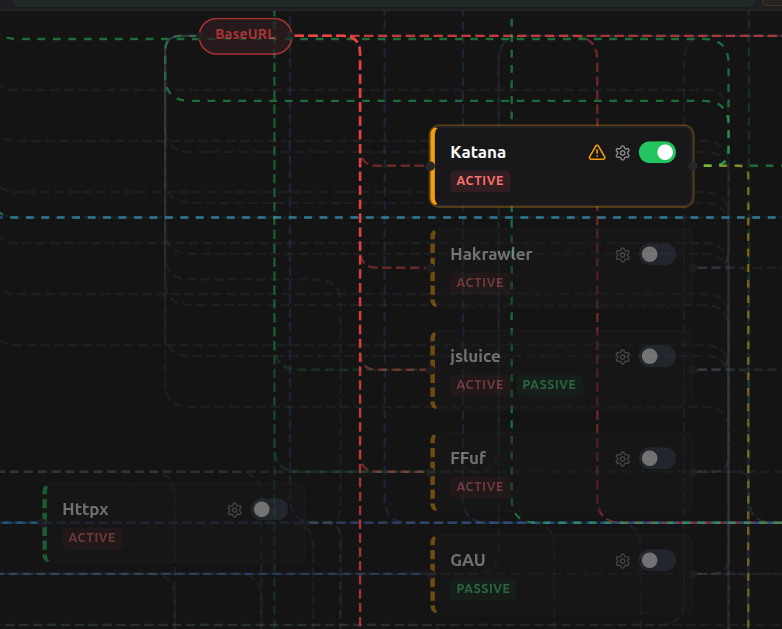
Common Chain Break Scenarios
| Scenario | Starved Data Node | Affected Tools |
|---|---|---|
| Httpx + GAU + ParamSpider all disabled | BaseURL | Katana, ZAP Ajax Spider, Hakrawler, jsluice, FFuf, Kiterunner, Arjun, Nuclei, JS Recon, Security Checks |
| All port scanners (Naabu, Masscan) + Shodan + OSINT Enrichment + Uncover all disabled | Port, Service | Nmap, Httpx |
| Nmap + Httpx all disabled | Technology | CVE Lookup |
| Shodan + OSINT Enrichment + Nmap + Nuclei all disabled | CVE | MITRE |
Note: BaseURL has three true sources: Httpx, GAU, and ParamSpider. Disabling only Httpx does NOT starve BaseURL if GAU or ParamSpider is still enabled. Similarly, Port has multiple true sources (Naabu, Masscan, Shodan, OSINT Enrichment, Uncover) -- all must be disabled for Port to be starved.
Important: The chain-breaking logic uses a "true source" algorithm. Tools that both consume AND produce the same data type (e.g., Katana consumes BaseURL and produces BaseURL) are treated as recyclers, not original sources. Only tools that create data from scratch count as true sources. Tools that only enrich a data type (e.g., Nmap enriches Port with version info) are not considered sources for chain-breaking purposes.
Clicking and Highlighting
Click a Tool Node
Clicking a tool node highlights it and all its directly connected data nodes and edges. Non-connected edges dim, making the tool's data dependencies easy to trace. Click the same node again or click empty canvas to clear the highlight.
Click a Data Node
Clicking a data node highlights it and all tools connected to it -- both producers and consumers. This is useful for understanding which tools contribute to a specific data type and which tools depend on it.
Open Tool Settings
Click the settings icon (gear) on any tool node to open a modal with the full settings panel -- identical to what you see in Tab View. Changes are saved to the same form data and reflected immediately in the graph.
Click the Input node to open the Target & Modules configuration. While creating a project, the dialog opens with a link, Upload it in RoE, for when you have a Rules of Engagement document: it takes you to the RoE tab, and the limits the document sets fill this form for you to review. See Rules of Engagement.
Produces, Enriches, and Consumes Reference
Every tool's input, output, and enrichment data types are defined in the node mapping and verified against the actual recon pipeline Cypher queries. Produces means the tool creates new graph nodes. Enriches means the tool adds properties to existing nodes (e.g. geo data, domain age, version info) without creating them.
Discovery Stage
| Tool | Consumes | Produces | Enriches |
|---|---|---|---|
| Subdomain Discovery | Domain | Subdomain, IP, DNSRecord, ExternalDomain | Domain |
| URLScan | Domain | Subdomain, ExternalDomain, Endpoint, Parameter | Domain, IP, BaseURL |
| Uncover | Domain | IP, Subdomain, Port, Endpoint | -- |
OSINT Stage
| Tool | Consumes | Produces | Enriches |
|---|---|---|---|
| Shodan | IP | Port, Service, Subdomain, ExternalDomain, DNSRecord, Vulnerability, CVE | IP |
| OSINT Enrichment | IP, Domain | Subdomain, Port, Service, ExternalDomain, DNSRecord, Certificate, Vulnerability, CVE | IP, Domain |
Port Scanning Stage
| Tool | Consumes | Produces | Enriches |
|---|---|---|---|
| Naabu | IP, Subdomain | Port, Service | IP, Domain |
| Masscan | IP | Port, Service | IP, Domain |
| Nmap | IP, Port | Technology, Vulnerability, CVE | Port, Service |
HTTP Probing Stage
| Tool | Consumes | Produces | Enriches |
|---|---|---|---|
| Httpx | Subdomain, IP, Port | BaseURL, Certificate, Technology, Header | Subdomain, Domain |
Resource Enumeration Stage
| Tool | Consumes | Produces | Enriches |
|---|---|---|---|
| Katana | BaseURL | Endpoint, Parameter, BaseURL, ExternalDomain | -- |
| ZAP Ajax Spider | BaseURL, Endpoint | Endpoint, Parameter, BaseURL, ExternalDomain | -- |
| Hakrawler | BaseURL | Endpoint, Parameter, BaseURL, ExternalDomain | -- |
| jsluice | BaseURL, Endpoint | Endpoint, Parameter, BaseURL, Secret, ExternalDomain | -- |
| FFuf | BaseURL, Endpoint | Endpoint, BaseURL, ExternalDomain | -- |
| GAU | Domain, Subdomain | Endpoint, Parameter, BaseURL, ExternalDomain | -- |
| ParamSpider | Domain, Subdomain | Endpoint, Parameter, BaseURL, ExternalDomain | -- |
| Kiterunner | BaseURL | Endpoint, BaseURL | -- |
| Arjun | BaseURL, Endpoint | Parameter | -- |
JS Recon Stage
| Tool | Consumes | Produces | Enriches |
|---|---|---|---|
| JS Recon | BaseURL, Endpoint | Secret, Endpoint, JsReconFinding (incl. Phase 6 ai-sdk-* finding types: ai-sdk-client, ai-sdk-key-literal, ai-sdk-browser-allowed, ai-frontend-detected, ai-provider-url) | Secret (Phase 6 mixin sets ai_provider + ai_finding_id on Secret nodes whose matched_text matches an AI key prefix and overlaps a Phase 6 captured value) |
Supply-Chain Recon Stage
Runs as GROUP 5.5 (after JS Recon, before Vulnerability scanning), gated on supplyChainReconEnabled (off by default). It consumes only data JS Recon already downloaded, so it makes no new network request. See Supply-Chain Scanning.
Three further passes run inside the same stage, so they inherit partial-recon
parity automatically: incident enrichment (attaches the catalog write-up to
findings that already exist), malicious-host correlation (compares the
target's own base URLs and the hosts its JavaScript came from against the
catalog's attacker domains, writing ThreatPulse + CONTACTS_MALICIOUS_HOST),
and typosquat detection. All three are local lookups against the offline
incident catalog and add no network traffic.
| Tool | Consumes | Produces | Enriches |
|---|---|---|---|
| Supply-Chain Recon | source maps + http_probe technologies + downloaded JS (from JS Recon) + the offline incident catalog | Package, MalPackageFinding, Vulnerability (source='osv'), ThreatPulse (sca- prefixed) | BaseURL (adds DEPENDS_ON -> Package for each served base URL, and CONTACTS_MALICIOUS_HOST -> ThreatPulse when a contacted host is in the catalog; never mutates the BaseURL node) |
AI Surface Recon Stage
Runs as Phase 4.5 (after Resource Enumeration / JS Recon, before Vulnerability scanning). Sends benign, protocol-aware probes to confirm and characterize AI/LLM/MCP/vector-DB surfaces. Deterministic — it makes no LLM calls (distinct from the AI in Pipeline decision hooks).
| Tool | Consumes | Produces | Enriches |
|---|---|---|---|
| AI Surface Recon | BaseURL, Endpoint (ai_interface_type), IP/Port (ai-vector-db), http_probe AI flags | Vulnerability (MCP tool-poisoning, source=ai_surface_recon), Parameter (MCP tool args), Technology (ai-* confirmed via Julius + vector-DB reads) | Endpoint (ai_supports_tools/vision/streaming, ai_model_family_guess, ai_model_ids, ai_latency_p50_ms, ai_mcp_*, ai_tool_schema_ref); Port (HAS_TECHNOLOGY → ai-vector-db) |
Vulnerability & Security Stage
| Tool | Consumes | Produces | Enriches |
|---|---|---|---|
| Nuclei | BaseURL, Endpoint, Technology, Domain | Vulnerability, Endpoint, Parameter, CVE, MitreData, Capec | -- |
| GraphQL Scan | BaseURL, Endpoint, Domain | Vulnerability, CVE | Endpoint (GraphQL capability flags: graphql_graphiql_exposed, graphql_tracing_enabled, graphql_get_allowed, graphql_field_suggestions_enabled, graphql_batching_enabled, graphql_cop_ran, schema hash, operation counts) |
| Web Cache Poisoning | BaseURL, Endpoint, Technology | Vulnerability (source=cache_poisoning, with confidence_tier, cache_header/cache_param, cache_impact, cache_buster, poc_link, curl_verify) | -- |
| CVE Lookup | Technology | CVE, MitreData, Capec | -- |
| MITRE | CVE | MitreData, Capec | -- |
| Security Checks | BaseURL, IP, Subdomain, Domain | Vulnerability | IP |
Partial Recon
Partial Recon lets you run any single tool from the pipeline independently, without re-running the entire scan. Every tool node in the Workflow View has a dedicated Run partial recon button (the play icon on each section header). Clicking it opens a modal where you configure exactly what to scan, review the graph data the tool will operate on, and launch the tool in isolation.
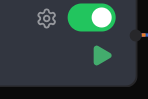
Results are merged back into the existing graph using Neo4j MERGE operations -- duplicates are updated, not recreated. This makes partial recon fully incremental: you can run the same tool multiple times and the graph stays clean.
Important: Partial recon uses the settings saved on the project. Every parameter you configured in the project form (timeouts, wordlists, thread counts, API keys, etc.) applies to the partial run. The tool's enabled flag is force-set to
trueregardless of whether you disabled it in the project settings -- everything else uses your saved configuration.
How It Works
- You click the play icon on a tool section header (or the tool node in Workflow View)
- The modal fetches graph inputs -- it queries Neo4j for existing data relevant to that tool (how many subdomains, IPs, ports, BaseURLs, or endpoints are already in the graph)
- You optionally add custom targets (subdomains, IPs, ports, or URLs depending on the tool)
- You choose whether to include graph targets alongside your custom inputs
- Clicking Run sends the request to the orchestrator, which spawns a lightweight recon container running only that tool
- The container loads project settings from the webapp API, merges your custom inputs with graph data, runs the tool, and writes results back to Neo4j
Domain-Batch Projects (Several Roots)
A project in Domain batch mode has several root domains. Partial recon covers every root in one run:
- The modal lists the roots it will scan. Past three roots, the list collapses to a count.
- Graph counts cover every current root. A Domain node left over from a root you removed from the batch is listed as not in this project any more and is not scanned; the next full recon removes it. A root with no recon data yet is marked no recon data yet.
- Custom inputs may name any root. A subdomain or URL under any of the project's roots is accepted, and each host is attached to its own root in the graph.
- Each group keeps its scope. A wildcard group (
*) is scanned in full. A literal group is scanned exactly as uploaded: only its listed hostnames, and its apex only if you listed.. - Subdomain Discovery enumerates wildcard roots only. The modal shows a checklist of the roots allowed to enumerate. A literal group is skipped, because it is scanned exactly as uploaded.
- URLScan, Uncover, Shodan, OSINT Enrichment and Subdomain Discovery run once per root, one root after another. If one root fails or is rate-limited, the others still run, and a rate-limited root is retried once.
The orchestrator derives the roots from the saved project, never from the request, and the container checks each root again before scanning. A root is refused if the Rules of Engagement exclude it or, when ownership verification is on, if its ownership is not verified. The run's log ends with a report: the roots scanned, then every other root with its reason (refused-roe, refused-ownership, no_results, rate_limited, failed, or not scanned). The run is marked as failed only when no root ran.
Deleting a project also stops its running partial recons.
The Partial Recon Modal
Every tool's modal shares the same layout but exposes different input sections depending on what the tool consumes.
Input / Output Flow
At the top of every modal you see two panels connected by an arrow:
- Input (blue) -- lists the node types the tool consumes (e.g., IP, Subdomain, Port) and the current counts from the graph (e.g., "example.com (12 IPs, 34 subdomains)")
- Output (green) -- lists the node types the tool produces (e.g., Port, Service) and the types it enriches (shown with a dashed border)
Below that, a description explains what the tool does and how targets are loaded.
Include Graph Targets
The "Include existing graph targets" checkbox (enabled by default) controls whether the tool operates on data already in the graph. When unchecked, the tool only scans your custom inputs. This is useful when you want to scan a specific IP or URL without re-scanning everything.
Custom Input Sections
Different tools expose different input fields. Each field accepts one value per line and validates in real time:
| Input Type | Available For | Validation Rules |
|---|---|---|
| Custom Subdomains | Naabu, Httpx, GAU, ParamSpider, Security Checks | Must be a valid hostname under one of the project's root domains |
| Custom IPs | Naabu, Masscan, Nmap, Httpx, Shodan, OSINT Enrichment, Security Checks | IPv4, IPv6, or CIDR notation. CIDR restricted to /24-/32 (v4) or /120-/128 (v6) |
| Custom Ports | Nmap, Httpx | Integer 1-65535 |
| Custom URLs | Katana, ZAP Ajax Spider, Hakrawler, jsluice, FFuf, Kiterunner, Arjun, Nuclei, JS Recon, Security Checks, GraphQL Scan, Web Cache Poisoning | Must use http/https and the hostname must be in the project scope |
| JS File Upload | JS Recon only | Upload .js files for offline analysis |
Attach-To Dropdowns
When adding custom IPs, you can optionally select an "Attach IPs to subdomain" dropdown. This tells the system which existing subdomain the IPs belong to, so they are linked correctly in the graph (as HAS_IP relationships) instead of being created as standalone UserInput nodes.
Similarly, when adding custom URLs for resource enumeration tools, you can select an "Attach URLs to BaseURL" dropdown to link discovered endpoints to a specific parent BaseURL.
Nuclei-Specific Options
The Nuclei modal includes three additional toggles that override project settings for the partial run:
- CVE Lookup -- cross-reference discovered technologies with NVD/Vulners for known CVEs
- MITRE ATT&CK -- enrich vulnerabilities with MITRE ATT&CK techniques, CWE, and CAPEC mappings
- Security Checks -- run the 26 built-in security configuration checks alongside Nuclei templates
API Key Warnings
For tools that benefit from API keys (Shodan, URLScan, Uncover, OSINT Enrichment, Nuclei), the modal checks your user settings and shows a warning for each missing key with an explanation of the impact. For example, running Shodan without a key falls back to InternetDB (free) which provides less data.
Tool Input Categories
The supported tools fall into distinct categories based on what inputs they need:
| Category | Tools | Primary Graph Inputs | Custom Inputs Accepted |
|---|---|---|---|
| Discovery | Subdomain Discovery, URLScan, Uncover | Domain | -- |
| Port Scanning | Naabu, Masscan | IPs, Subdomains | Subdomains, IPs |
| Service Detection | Nmap | IPs, Ports, Subdomains | Subdomains, IPs, Ports |
| HTTP Probing | Httpx | Subdomains, IPs, Ports | Subdomains, IPs, Ports |
| Crawling / Fuzzing | Katana, ZAP Ajax Spider, Hakrawler, jsluice, FFuf, Kiterunner | BaseURLs | URLs |
| Passive URL Discovery | GAU, ParamSpider | Domain, Subdomains | Subdomains |
| Parameter Testing | Arjun | BaseURLs, Endpoints | URLs |
| JS Analysis | JS Recon | BaseURLs, Endpoints | URLs, JS file uploads |
| Vuln Scanning | Nuclei | BaseURLs, Endpoints | URLs |
| GraphQL Security | GraphQL Scan | BaseURLs, Endpoints, JS Recon findings | URLs (validated against project scope; injected via GRAPHQL_ENDPOINTS) |
| Web Cache Poisoning | Web Cache Poisoning | BaseURLs, Endpoints | URLs (validated against project scope; injected as extra targets) |
| Security Checks | Security Checks | IPs, Subdomains, BaseURLs | Subdomains, IPs, URLs |
| OSINT | Shodan, OSINT Enrichment | IPs | IPs |
Example: Port Scanner (Naabu)
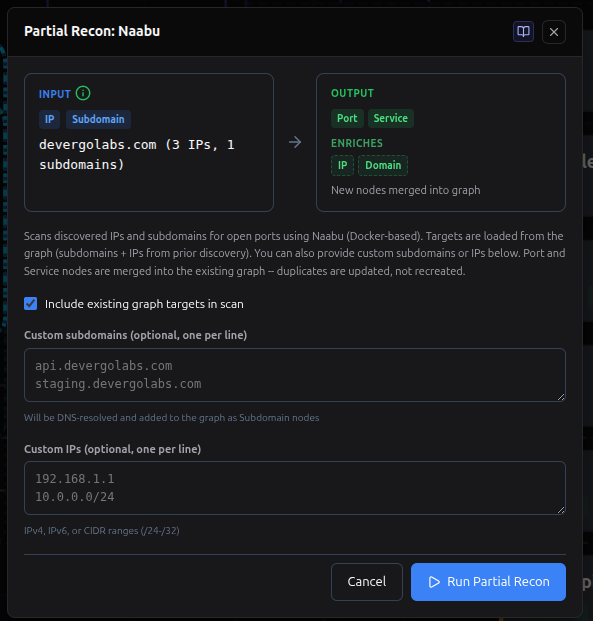
Naabu accepts custom subdomains and custom IPs in addition to graph targets. The input panel shows how many IPs and subdomains are already in the graph. Custom subdomains are resolved to IPs and added to the scan. Custom IPs can optionally be attached to an existing subdomain via the dropdown, so the graph relationship is preserved.
Example: Crawler (Katana)
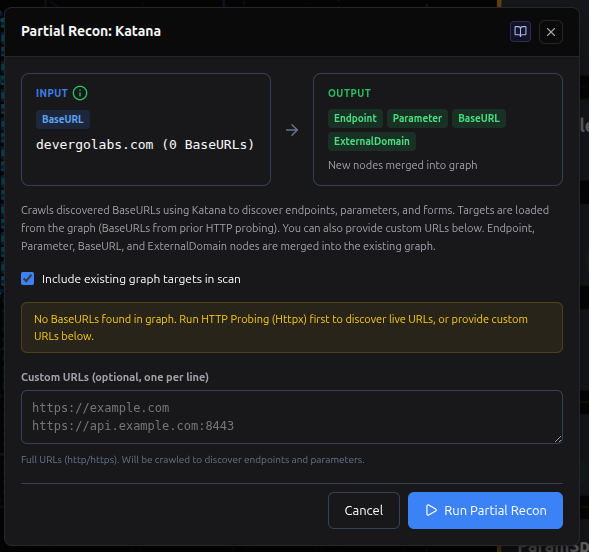
Katana accepts custom URLs that must be within the project scope. The input panel shows how many BaseURLs are already in the graph. Custom URLs are validated against the project domain -- out-of-scope URLs are rejected with a clear error. The "Attach URLs to BaseURL" dropdown lets you link discovered endpoints to a specific parent URL.
Example: Vulnerability Scanner (Nuclei)
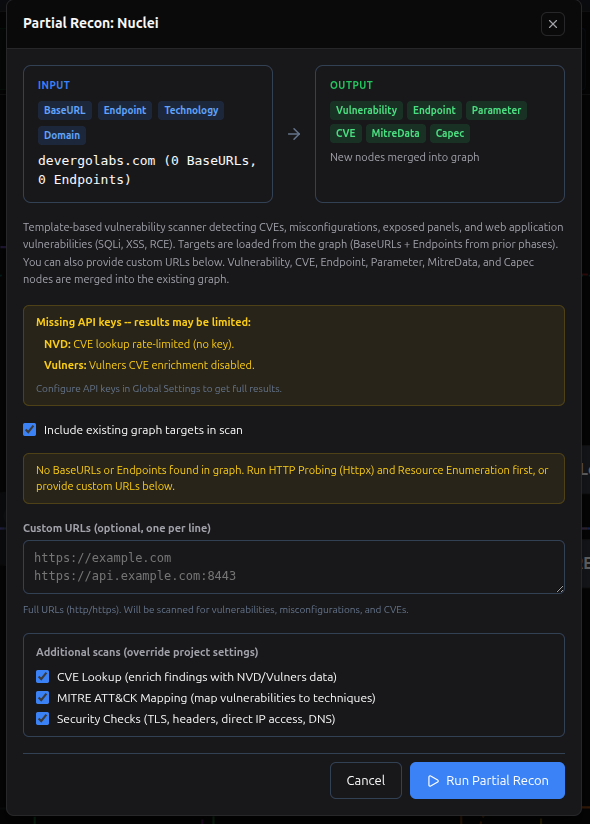
Nuclei shows the richest modal. Beyond custom URLs, it exposes three settings overrides (CVE Lookup, MITRE ATT&CK, Security Checks) that let you toggle sub-features without changing the project settings. It also shows API key warnings when NVD or Vulners keys are missing, explaining the impact on CVE enrichment.
Graph Merge Behavior
Partial recon never duplicates data. Every graph update uses MERGE statements:
- If a node already exists (matched by its unique key -- e.g., subdomain name, IP address, port number on an IP), it is updated with new properties
- If the node does not exist, it is created
- Relationships are similarly merged -- running the same tool twice produces the same graph, not a doubled graph
When you provide custom inputs, the system creates a UserInput node in the graph linked to the results via PRODUCED relationships. This lets you trace which findings came from manual input vs. automated discovery. Orphan UserInput nodes (with no produced results) are automatically cleaned up.
Empty Graph Warnings
If the graph has no data for a tool's required inputs and you have not provided custom targets, the modal shows a contextual warning. For example:
- Naabu with 0 IPs: "Run Subdomain Discovery first to populate IPs, or add custom IPs/subdomains below"
- Katana with 0 BaseURLs: "Run Httpx first to discover BaseURLs, or add custom URLs below"
- Nmap with 0 Ports: "Run Naabu first to discover ports, or add custom IPs and ports below"
The Run button is disabled when there are validation errors or when no targets are available (graph empty + no custom inputs + graph targets unchecked).
AI in Pipeline
For a focused deep-dive on each helper, the never-raise / key-boundary / cache contracts, and how this differs from Adversarial AI Recon, see AI in the Recon Pipeline.
Most security tools ship with static lists -- FFuf has its built-in extensions list, Nuclei has its cve,xss,sqli,... default tags, security checks have their hard-coded WAF header tokens. These lists were curated at one point in time, but the targets aren't static. CVE-2026 templates land monthly. WAF vendors rebrand their Server headers and rotate cookie names. A new tech stack pops up that nobody added rules for. The lists drift, and recon ends up firing thousands of irrelevant probes (every WordPress tag against a Node app, every PHP extension against ASP.NET) while silently missing what it can't recognise (a Cloudflare Workers WAF that strips cf-ray).
AI in Pipeline is RedAmon's answer to this drift. At specific decision points inside the recon pipeline, the relevant tool's planner pauses, asks the LLM "given the actual response/fingerprint we just observed, what should I run?", and feeds the answer back into the tool's command before execution. The pipeline still runs deterministically end-to-end -- this is decision augmentation, not agent autonomy. The LLM doesn't choose targets, doesn't write its own scans, doesn't sequence tools. It only narrows or sharpens decisions that the tool was about to make anyway.
This is a different layer from the agent features in the rest of RedAmon. The agent (chat, fireteam, attack-paths) operates above the recon pipeline, making strategic decisions across runs. AI in Pipeline operates inside a single recon run, replacing static look-ups with response-aware ones. The two are independent: you can run the agent on top of a fully static recon, or run AI in Pipeline without ever talking to the agent. They share the same per-user provider keys and the same model picker, but they're triggered by different parts of the system.
Four concrete benefits drive most projects to enable it:
- Less wasted work. AI-driven tag/extension lists drop ~30-50% of irrelevant probes. The bandwidth and time you save go into deeper coverage where it matters.
- Higher recall on modern targets. The WAF AI classifier catches header-stripped or rebranded firewalls the static path silently misses, reducing false negatives in WAF-bypass checks.
- Fewer false positives in findings. The Nuclei response filter and takeover disambiguator distinguish real findings from WAF block pages, so injection findings on AWS-WAF-fronted targets and high-severity takeover alerts on Cloudflare-protected hostnames stop pinging on-call at 3am.
- Self-updating coverage. New tech buckets and CVE-year tags land in the candidate pool automatically (read live from the Nuclei templates volume) -- no recon rebuild needed when ProjectDiscovery ships a new template category.
AI in Pipeline is a master switch in the project's Target & Modules tab that unlocks per-tool AI hooks. When the master is OFF, the recon container makes no LLM or Jev calls and every per-tool AI flag is forced OFF (defense-in-depth -- the cascade prevents drift between the master and the individual flags).
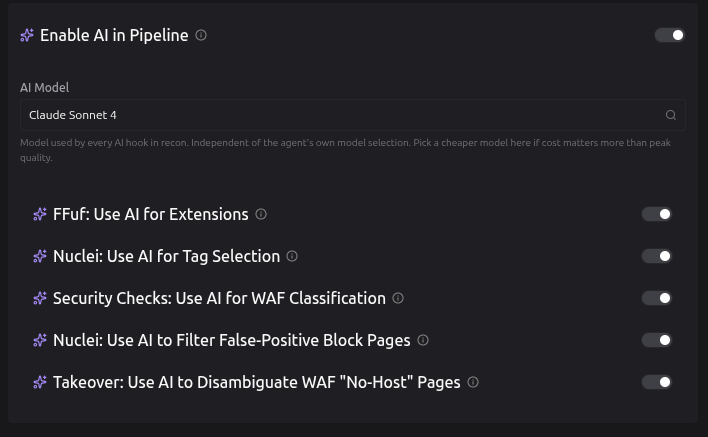
How the master toggle works
- Master OFF (default). Every per-tool AI flag is forced OFF and disabled in the UI. The recon pipeline runs entirely on static configuration. Zero LLM or Jev calls, zero per-user API key usage.
- Master ON. At scan start the master forces every per-tool AI flag ON, so all five hooks run whatever their individual toggles show. What you choose per hook is the engine: each card's Engine row picks LLM or Jev for the four hooks TypeSafe Jev can answer. The Nuclei false-positive filter reads LLM only. The five Jev-only hooks below follow, each with an Off | Jev row; the master switch unlocks them but never sets or resets them.
- AI Model. Pick the model used by every AI hook on the LLM engine. This is independent of the agent's own model selection -- pick a cheaper model here if cost matters more than peak quality.
- Jev engine. Next to the AI Model, the TypeSafe AI (Jev) panel shows whether your account has a Jev token. With none it offers the same key input as Global Settings (saved to your account, not to the project); with one it confirms it is included, with a Manage link.
Bidirectional toggles
Each per-tool AI toggle, and its Engine control, appears in two places:
- The master AI in Pipeline panel in the Target & Modules tab (shown above).
- The tool's own settings section (FFuf, Nuclei, ...).
Both controls are bound to the same form field, so flipping either updates the other automatically. The tool's section additionally dims the static input that the AI replaces when the toggle is on (e.g. the FFuf "Extensions" textbox is greyed out when "Use AI for Extensions" is enabled).
The five current AI hooks
| Hook | Tool | Pattern | Replaces / augments |
|---|---|---|---|
| FFuf: AI for Extensions | FFuf (resource enumeration) | Per-target, cached by tech fingerprint | The static ffufExtensions list |
| Nuclei: AI for Tag Selection | Nuclei (vulnerability scan) | Per-scan, aggregated tech fingerprint | The static nucleiTags include list |
| WAF AI Classifier | Security Checks (check_waf_bypass, _has_cdn_markers) | Per-response, cached by response fingerprint | Augments the static header-token list |
| Nuclei: AI Response Filter | Nuclei (is_false_positive) | Per-finding, cached by response fingerprint | Augments the static WAF/rate-limit keyword list |
| Takeover AI Classifier | Subdomain Takeover (_apply_ai_waf_disambiguation) | Per-finding, cached by response fingerprint | Disambiguates static fingerprint matches from WAF block pages |
Every hook except the Nuclei response filter can run on a second engine, TypeSafe Jev, a typed decision model, instead of the LLM. The Jev path takes the same request body on a /jev/* endpoint and returns the same shape, so the cache, validation and fallback below are unchanged.
FFuf: AI for Extensions
Before each FFuf fuzz, the planner sends a single HEAD request to the target and asks the configured model to suggest the most likely file extensions based on the response headers (Server, X-Powered-By, X-AspNet-Version). When on, the static FFuf extensions list is ignored. A per-fingerprint cache means N hosts behind the same stack collapse to one LLM call per scan.
- Helper:
recon/helpers/ai_planner/ffuf_extensions.py - Agent endpoint:
POST /llm/ffuf-extensions - Setting:
FFUF_AI_EXTENSIONS(camelCase:ffufAiExtensions) - Jev engine:
POST /jev/ffuf-extensions, settingFFUF_AI_USE_JEV(camelCase:ffufAiUseJev). Jev ranks a fixed 40-extension catalog and always keeps.bakand.old - Typical impact: 30-50% fewer FFuf requests per target with no recall loss, because the AI drops extensions that don't match the detected stack (e.g.
.aspxon Apache+PHP).
Nuclei: AI for Tag Selection
Once per scan, the planner aggregates the detected tech stack from http_probe (Wappalyzer technologies + Server headers) and asks the model to prune the Nuclei -tags list to ones matching the stack. Drops irrelevant tags like wordpress on a Node site, adds tech-specific ones like apache or wp-plugin when detected. The candidate tag pool is built dynamically from the live nuclei-templates volume (filtered to tags with at least 50 templates -- about 125 broad-category tags). When on, the static Include Tags list in the Nuclei module is ignored.
If http_probe data is missing (partial-recon-with-bare-URLs case), the planner does an opportunistic HEAD probe of up to 5 URLs to extract Server / X-Powered-By headers before calling the LLM. If even that yields no signal, the AI call is skipped and the user's static list is kept.
- Helper:
recon/helpers/ai_planner/nuclei_tags.py - Agent endpoint:
POST /llm/nuclei-tags - Setting:
NUCLEI_AI_TAGS(camelCase:nucleiAiTags) - Jev engine:
POST /jev/nuclei-tags, settingNUCLEI_TAGS_AI_USE_JEV(camelCase:nucleiTagsAiUseJev). Jev scores every candidate tag and always keeps the universal ones (cve,exposure,misconfig,default-login,kev,oast,takeover) - Typical impact: ~50% fewer templates loaded at scan time (the count column in the recon drawer drops from ~12,000 templates to ~6,000), with the same vulnerability coverage for the detected stack.
WAF AI Classifier
Modern WAFs (Cloudflare, Imperva, Akamai, F5, ...) often strip or rebrand the headers that static detection keys off of. The classifier sends each suspect response (status, headers, body sample, response time) to the LLM, which scores WAF presence on a 0-100 confidence scale based on body fingerprints (challenge pages, "Request blocked"), cookie shapes (__cf_bm, incap_ses_), latency outliers, and status+body mismatches that no fixed list can capture.
The classifier runs as a second pass after the static check inside _has_cdn_markers(). If the static path returns false but the AI is confident (>= 70%) a WAF is present, the verdict flips. This catches header-stripped WAFs that the static path silently misses, reducing false negatives in check_waf_bypass (which compares hostname vs IP responses to detect bypassable origins). A per-response-fingerprint cache prevents repeated LLM calls for the same fingerprint.
- Helper:
recon/helpers/ai_planner/waf_classifier.py - Agent endpoint:
POST /llm/waf-classify - Setting:
WAF_AI_CLASSIFIER(camelCase:wafAiClassifier) - Jev engine:
POST /jev/waf-classify, settingWAF_AI_USE_JEV(camelCase:wafAiUseJev). Jev answers "WAF or not" and picks one of 14 vendors; a bypass it detects recordsdetection_method: "jev_classifier" - Typical impact: catches modern WAFs with rebranded/stripped headers that the static token list misses, without false-positive bursts (the classifier returns a deterministic safe fallback on any failure).
Nuclei: AI Response Filter
Nuclei's existing false-positive filter (is_false_positive) keyword-matches response bodies for terms like "Access Denied", "Cloudflare", "WAF", "ModSecurity". That works for vendor-branded blocks but has two failure modes: (a) the keyword "WAF" appears in legitimate response bodies (admin panels with "WAF settings: enabled", API responses with waf_status: "ok", docs pages), so real findings get silently demoted; (b) rebranded WAF blocks (AWS WAF JSON {"message": "Forbidden"}, custom Imperva pages, Fortinet themed pages, empty 406 bodies) contain none of the keywords and ship as findings.
The AI filter runs as a second pass after the keyword check, but only when the keyword list missed AND the response shape still looks like a block (status 403/406/418/429/503 paired with an injection-class tag like sqli/xss/rce). The LLM classifies the body as is_blocked: true|false with calibrated confidence; if blocked at confidence >= 70%, the finding is moved to the false_positives list and never ships as a vuln. Pure 200 OK responses bypass the AI call to keep cost bounded. A per-response-fingerprint cache collapses identical block pages across many findings to a single LLM call per scan.
- Helper:
recon/helpers/ai_planner/nuclei_response_filter.py - Agent endpoint:
POST /llm/nuclei-fp-filter - Setting:
NUCLEI_AI_RESPONSE_FILTER(camelCase:nucleiAiResponseFilter) - Typical impact: suppresses fake injection findings on AWS-WAF-fronted targets and surfaces real findings the keyword filter wrongly hides (admin panels mentioning WAF terms in legitimate context).
Takeover: AI Classifier
Subjack and Nuclei takeover templates fingerprint response bodies for strings like "There's nothing here yet" (Heroku), "NoSuchBucket" (S3), "The page you have requested does not exist" (Bitbucket). WAFs gating a hostname they don't recognise return very similar text — "The requested resource was not found", "Forbidden", generic "page not found" 404s. The collision produces critical-severity false positives that page on-call.
The classifier runs as an enrichment pass between CNAME validation and dedupe/scoring. For each takeover candidate the scanner probes the hostname (HTTPS first, HTTP fallback, 4KB body cap). If the response carries an unambiguous third-party vendor token (Heroku-Request-Id, x-amz-bucket-region, Server: GitHub.com, Server: Netlify, ...), the AI is skipped — the third-party fingerprint is genuine. Otherwise the LLM classifies the body as is_waf_block: true|false. AI-flagged collisions get ai_waf_likely=true set on the finding, which feeds back into score_finding as a -40 score penalty, usually enough to move a finding down a verdict: the strongest DNS-only static signal (subjack + nuclei + auto-exploitable provider + cname method = score 100) drops to 60, likely rather than confirmed at the default threshold of 60, and a merely likely candidate drops to manual_review. Per-response-fingerprint cache deduplicates across hostnames behind the same WAF.
- Helper:
recon/helpers/ai_planner/takeover_classifier.py - Agent endpoint:
POST /llm/takeover-classify - Setting:
TAKEOVER_AI_CLASSIFIER(camelCase:takeoverAiClassifier) - Jev engine:
POST /jev/takeover-classify, settingTAKEOVER_AI_USE_JEV(camelCase:takeoverAiUseJev). A finding Jev down-scores carriesai_engine: "jev" - Typical impact: keeps the strongest takeover findings (multi-tool confirmed, auto-exploitable provider, cname method) but deflects WAF-block collisions into manual_review where they can be reviewed without paging on-call.
Jev-only hooks
Five decisions run only on TypeSafe Jev, with no LLM version. Each needs aiInPipeline and its own setting. Each decision is logged next to the deterministic answer (jev-shadow ... lines, at most 50 per hook plus a summary) and kept in the recon output under jev_shadow.<hook>. See Decision records.
- Page-type labels, in HTTP probing (full scan and partial Httpx): five yes/no questions per distinct page (login wall, parked, default install page, placeholder, error page);
appunless one clears 0.70, and a deterministic pre-filter supplies the label for any page Jev gives no answer for. At most 300 distinct pages per scan, within 60 seconds.- Jev engine:
POST /jev/page-type, settingHTTPX_JEV_PAGE_TYPE(camelCase:httpxJevPageType). The label is written onto the Endpoint in the graph (page_class); it sends nothing to the target and changes nothing about what is scanned.
- Jev engine:
- FFuf base-path ranking, in smart fuzz, once per scan when the crawl found more directories than
ffufSmartFuzzMaxBasePaths: one yes/no per directory, "likely to hold sensitive, administrative or application content?".- Jev engine:
POST /jev/ffuf-base-paths, settingFFUF_JEV_BASE_PATHS(camelCase:ffufJevBasePaths). Chooses which directories fill the cap: FFuf fuzzes the ones Jev ranks highest, and the same number is fuzzed either way.
- Jev engine:
- Hakrawler seed order, once per scan: one yes/no per probed host, "likely to have a rich web application surface?". Partial recon keeps the alphabetical order.
- Jev engine:
POST /jev/crawl-seed-order, settingHAKRAWLER_JEV_SEED_ORDER(camelCase:hakrawlerJevSeedOrder). Reorders the seeds host by host so the promising hosts are crawled first; no seed is dropped, and Katana is not affected.
- Jev engine:
- Tool health, after the crawlers and collectors: every empty result is classified from its exit code and error output, with or without Jev, and one that looks like a failure is recorded as a coverage gap (and a failed Katana or Hakrawler keeps last run's jsluice secrets out of the prune). Jev is asked only about error output the check cannot place, at most 20 times per run.
- Jev engine:
POST /jev/tool-health, settingRESOURCE_ENUM_JEV_TOOL_HEALTH(camelCase:resourceEnumJevToolHealth). Records Jev's transient-or-permanent verdict next to the coverage gap; no tool is re-run.
- Jev engine:
- Serialized-object ranking, in the serialized-object scan (full scan and its partial recon), when that scan flagged candidates: per distinct blob, one pick-one "which format?" (one of 14) and one yes/no "an attacker-reachable deserialization sink?".
- Jev engine:
POST /jev/serialized-classify, settingSERIALIZED_SCAN_JEV_RANK(camelCase:serializedScanJevRank). Jev's format and reachability are written onto each candidate (deser_jev_format,deser_jev_exploitability) and the deserialization skill confirms the most reachable first; no candidate is dropped and the matched format is never rewritten. Each decision is also recorded underjev_shadow.serialized_assess.
- Jev engine:
Operational notes
- All five hooks never raise. On any LLM or Jev failure (network error, no API key or token, no credit, malformed response, rejected output) they fall back to the user's static configuration and log
[!][{Tool}-AI] ...lines ([!][{Tool}-Jev] ...on the Jev engine) in the recon drawer. A Jev failure never re-routes the hook to the LLM, and Jev has its own circuit breaker, so an exhausted Jev balance does not pause the LLM hooks. - Logs prefixed
[*][{Tool}-AI]/[*][{Tool}-Jev](normal events) and[!][{Tool}-AI]/[!][{Tool}-Jev](warnings/fallbacks) surface in the recon drawer SSE stream so you can verify the hook is firing at scan time. - The
aiPipelineModelsetting controls which model every hook on the LLM engine uses. The recon container delegates each call to the agent's/llm/*or/jev/*endpoints, so per-user provider API keys and the Jev token live in a single place (Global Settings -> LLM Providers) and never enter the scan container. - Stealth mode and AI in Pipeline are independent toggles. When both are on, stealth's narrowing (lower rate limits, expanded exclude lists, DAST off) still applies on top of whatever the AI picks -- AI cannot bypass stealth.
Tip: AI in Pipeline is most cost-effective on large scans (many subdomains, many BaseURLs). For a single-target test, the static lists are usually fast enough; the AI shines when N targets share a stack and the cache amortizes one LLM call across all of them.
Next Steps
- AI in the Recon Pipeline -- how the five LLM helpers sharpen individual scan steps
- TypeSafe Jev -- the typed decision model four of those hooks can run on instead of the LLM
- Running Reconnaissance -- start a scan and monitor progress
- Project Settings Reference -- complete reference for all 196+ parameters
- Recon Presets -- apply pre-built configurations with one click
- Attack Surface Graph -- explore the resulting knowledge graph