
Red Zone
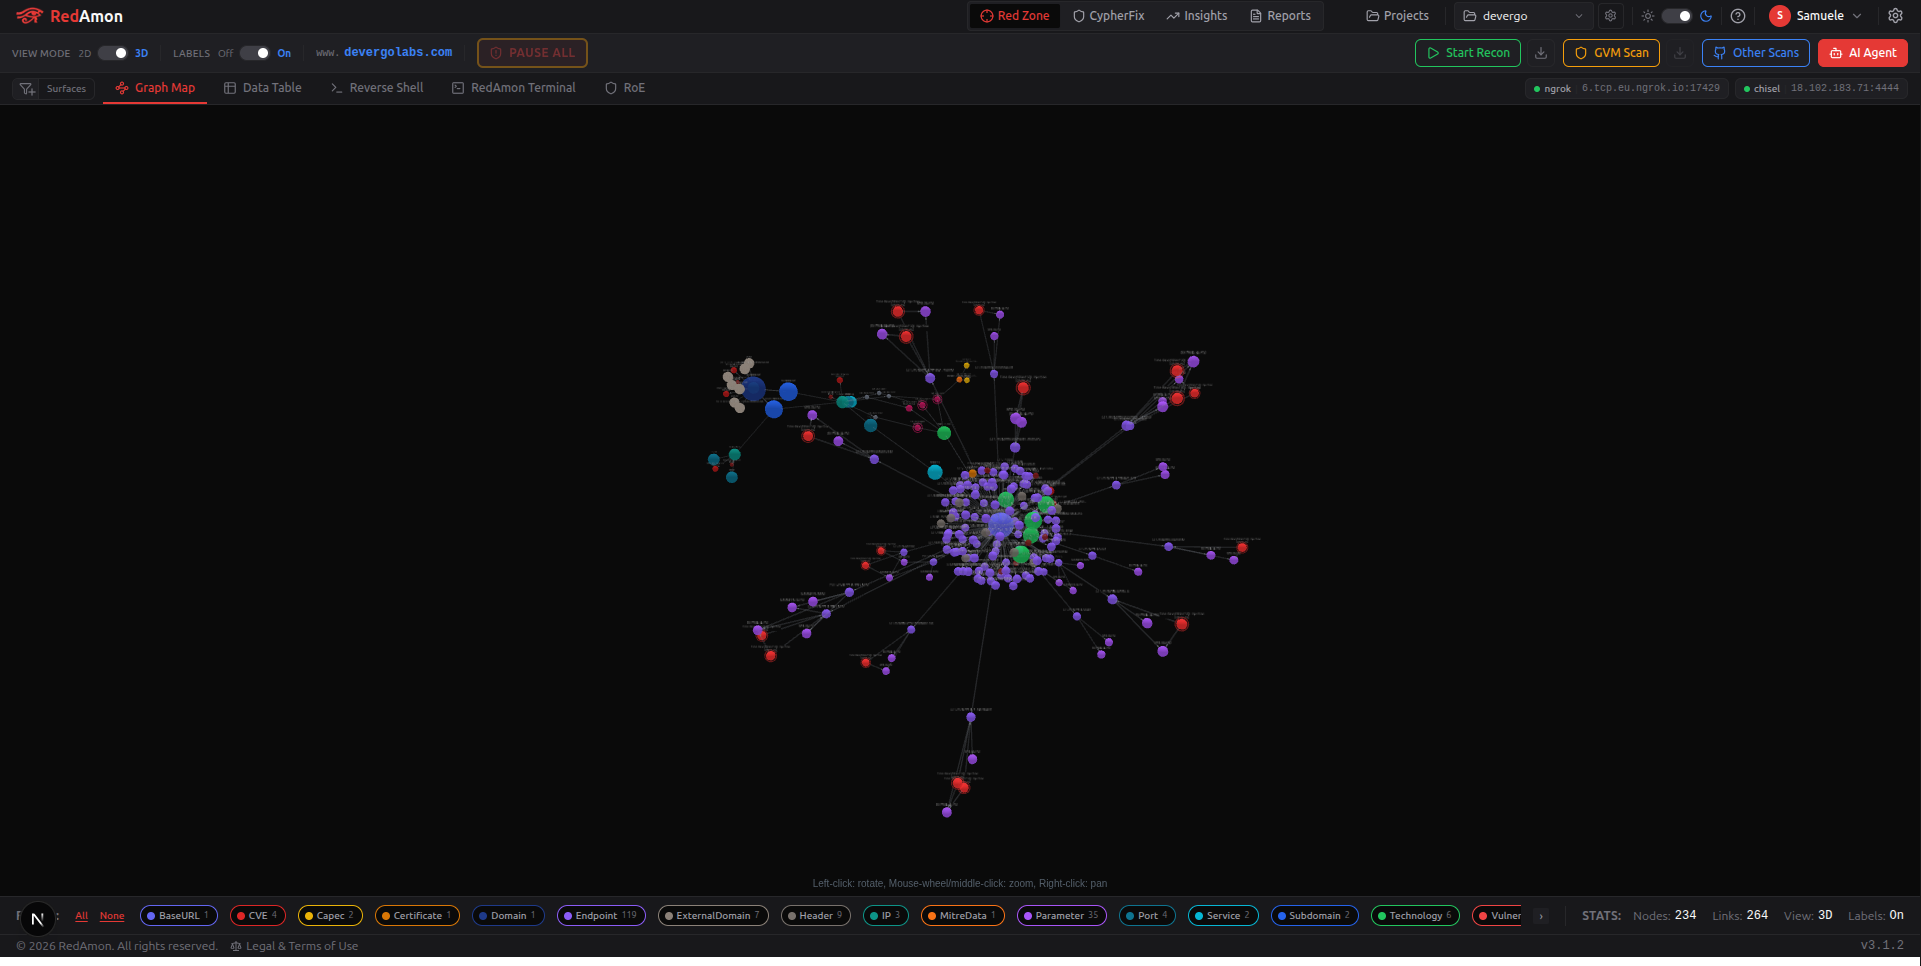
The Red Zone (/graph) is the primary interface of RedAmon. This is where you visualize your attack surface, launch scans, interact with the AI agent, and explore findings. This page gives you a complete tour of every element on screen.
Accessing the Red Zone
- Select a project from the Project Selector dropdown in the top navigation bar (or navigate from the Projects page)
- Click "Red Zone" in the top navigation bar (the crosshair icon)
- You'll land on the Graph page with your selected project loaded
Page Layout
The Graph page is organized into several sections:
| Area | Location | Purpose |
|---|---|---|
| Global Header | Top | Navigation, project selector, theme toggle |
| Graph Toolbar | Below header | Scan controls, view toggles, agent status |
| View Tabs | Below toolbar | Switch between Graph Map, Data Table, Reverse Shell, RedAmon Terminal, and RoE |
| Main Canvas | Center | 2D/3D graph visualization or data table |
| Bottom Bar | Bottom | Node type legend with filtering |
| Node Drawer | Left side (on click) | Detailed properties of selected node, plus copy-context / ask-agent / mute / delete actions |
| Logs Drawer | Right side (during scans) | Real-time scan logs |
| AI Agent Drawer | Right side (on toggle) | AI chat interface |
Global Header
The top navigation bar is present on every page.
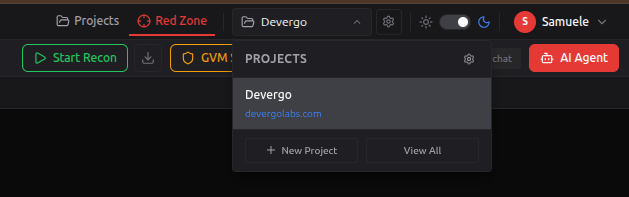
| Element | Description |
|---|---|
| RedAmon Logo | Click to go home |
| Projects (folder icon) | Navigate to the Projects management page |
| Red Zone (crosshair icon) | Navigate to the Red Zone (current page) |
| Project Selector | Dropdown to switch between projects. Shows project name and target domain. Selection persists across sessions |
| Theme Toggle | Switch between light and dark mode |
| User Avatar | Shows the current user |
Graph Toolbar
The toolbar is organized into two rows with action groups. The Render, 2D / 3D and Labels toggles are not here: they sit on the right of the View Tabs strip, and only while the Graph Map view is active.


Row 1 — Context & Emergency Pause
| Control | Description |
|---|---|
| Wiki button | Opens this page |
| Target Info | Displays the current project's target domain and subdomain configuration |
| Stealth Indicator | Shows if stealth mode is active (passive-only scanning) |
| Limits badge | Shown while the engagement's limits are live: a rate ceiling, an excluded host or a scanning window. See Rules of Engagement |
| Version selector | Scan N — <date> UTC. Switches the graph to a saved Scan Timeline version. While a past version is being viewed, every scan's Start is disabled |
| PAUSE ALL | Emergency button (red/yellow) — instantly freezes all running pipelines (Recon, GVM, GitHub Hunt) and stops all AI agent conversations. The Secret Multiscanner and partial recon have no pause, so their live runs are stopped instead. Disabled when nothing is running. Shows "PAUSING..." with a spinner while the operation is in progress |
When to use PAUSE ALL: If you notice the recon, GVM scanner, or AI agent are targeting something unintended, click this button immediately. It freezes containers via Docker cgroups (no data loss) and cancels all running agent tasks. You can resume individual pipelines afterwards using their respective Resume buttons.
Row 2 — Action Groups
The second row contains four color-coded action groups:
Recon Actions (Green)
| Button | Description |
|---|---|
| Start Recon | Launches the 6-phase reconnaissance pipeline. Shows a confirmation modal first. Spinner appears while running |
| Pause (pause icon) | Freezes the recon container. Only visible while running |
| Stop (square icon) | Stops and removes the recon container permanently. Only visible while running or paused |
| Resume | Resumes a paused recon from where it left off |
| Logs (terminal icon) | Opens the logs drawer to show real-time recon output. Only visible during an active scan |
| Download (download icon) | Download the recon results as JSON. Only available after recon completes |
GVM Vulnerability Scan (Yellow, Shield icon)
| Button | Description |
|---|---|
| GVM Scan | Launches a GVM/OpenVAS network vulnerability scan. Disabled in stealth mode |
| Pause / Stop / Resume | Same lifecycle controls as Recon (see above) |
| Logs (terminal icon) | Opens the GVM logs drawer |
| Download (download icon) | Download GVM results as JSON |
Other Scans (Blue, GitHub icon)
| Button | Description |
|---|---|
| Other Scans | Opens a modal containing GitHub Secret Hunt, Secret Multiscanner and Supply Chain Scanner, each with independent Start, Stop, Logs and Download controls (GitHub Secret Hunt and Supply Chain also pause and resume; the Secret Multiscanner does not). The Secret Multiscanner card lists one row per configured source, each with its own status badge, Start, Stop and Logs, and several sources can run at the same time |
The Other Scans modal provides three standalone scan modules, each independent of the recon pipeline:
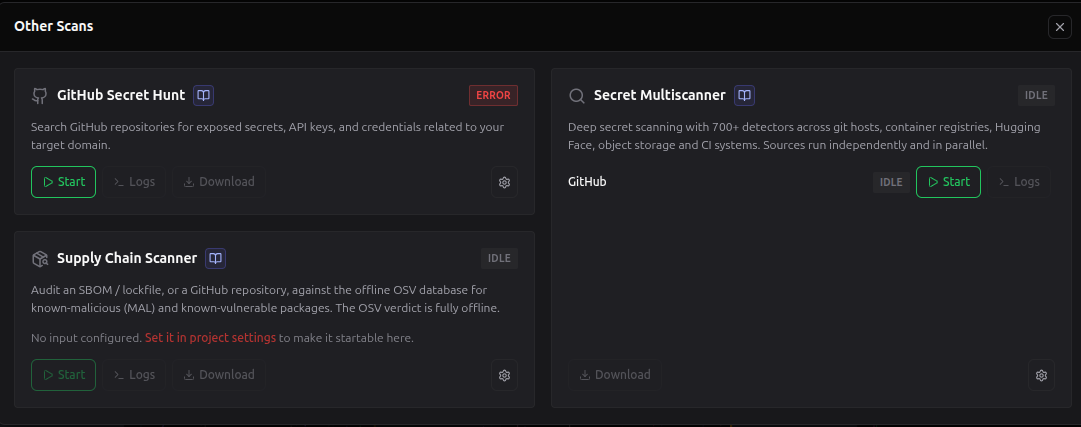
| Scanner | Description |
|---|---|
| GitHub Secret Hunt | Regex-based secret scanning with 40+ patterns and Shannon entropy analysis. See GitHub Secret Hunting |
| Secret Multiscanner | 1060 secret detectors across 14 sources (git hosts, container registries, Hugging Face, object storage, CI systems), with optional verification against live APIs. One startable row per configured source. See Secret Multiscanner |
| Supply Chain Scanner | Audits a dependency manifest against the offline OSV database for known-malicious (MAL-) and known-vulnerable (CVE / GHSA) packages. The input is picked in Project Settings > Other Scans > Supply Chain Scanner (the card's gear links there): an Uploaded SBOM / lockfile (CycloneDX / SPDX, package-lock.json, yarn.lock, go.sum, ..., max 10 MB), a GitHub repository (owner/repo + optional branch/tag, cloned shallowly in the sandbox), or a GitHub organization (queues one scan per repo). The card names the configured input and Start stays disabled until there is one. Writes Package / MalPackageFinding nodes, read by the Supply-Chain SCA table. Needs ./redamon.sh supply-chain-sync npm once, to populate the offline database. See Supply-Chain Scanning |
GitHub Secret Hunt and the Supply Chain Scanner each hold their own github.com token in Global Settings, and Supply Chain needs its one only for a private GitHub repository (uploads and public repos need no token). The Secret Multiscanner holds a third: one key per source, in its own Secret Multiscanner drawer under Global Settings > API Keys. All three run independently (GitHub Secret Hunt and Supply Chain add Pause and Resume to Start / Stop / Logs / Download; the Secret Multiscanner has no pause, and its Start / Stop / Logs are per source), and all three write the live graph, so none of them can be started while a saved (past) scan version is being viewed.
Agent Status (Right side)
| Element | Description |
|---|---|
| Workspace Folder Icon | Opens the FileSystem Drawer on the left — drag-and-drop uploads, file previews, and a Jobs tab for background scans. See Agent Workspace for the full reference |
| Conversation Badge | Shows the number of active AI agent conversations |
| Phase Badge | Current agent phase (Informational / Exploitation / Post-Exploitation) with phase-specific color |
| Step Counter | Current iteration number of the agent |
| AI Agent Button | Toggle the AI Agent drawer open/closed |
View Tabs
Just below the toolbar, five tabs let you switch views:
| Tab | Icon | Description |
|---|---|---|
| Graph Map | Waypoints | The interactive graph visualization (default) |
| Data Table | (varies) | Dropdown tab exposing 20 presets: 3 base views (Node Inspector, All Nodes, JS Recon) + 17 Red Zone finding tables (incl. AI Surface, AI Risk, Web Cache Poisoning, and Supply-Chain SCA). See Data Table below. |
| Reverse Shell | Terminal | Manage agent-opened sessions (meterpreter, netcat, reverse/bind shells, listeners — formerly "Remote Shells") |
| RedAmon Terminal | SquareTerminal | Direct interactive PTY shell access to the Kali sandbox container via xterm.js |
| RoE | Shield | The engagement's limits and record, with Upload RoE, Replace RoE, Remove and the document download. See Rules of Engagement |
When in Data Table mode, a header chevron opens the preset picker. Each preset renders its own header row with per-table search, refresh, and three export buttons — XLSX, JSON, and MD (Markdown). See Data Export & Import for format details.
Scan Timeline tabs. Next to Graph Map you will also find two tabs with a green NEW badge, Recon Delta and Scans, plus a version switcher in the header (
Scan N — <date> UTC). These belong to the Scan Timeline feature: keep each scan as a version, view or activate past versions, diff two scans, schedule future scans, and follow the live scan queue and run history of every scan type.
View toggles (right of the tabs strip)
While the Graph Map view is active, three switches sit on the right of the tabs strip:
| Toggle | Description |
|---|---|
| Render | Turn graph rendering off entirely. While off, the graph is not fetched, queried or drawn, and the canvas shows a short "rendering is off" panel with a button to turn it back on. Use it when a project has grown large enough that laying the graph out makes the tab sluggish — the data is still there, browse it from Node Inspector or any other table view. |
| 2D / 3D | Layout mode. Auto-forced to 2D above the 3D node threshold, and greyed out while Render is off. |
| Labels | Show or hide node labels. Greyed out while Render is off. |
All three are saved per user, per project.
RedAmon Terminal
The RedAmon Terminal tab provides full interactive shell access to the kali-sandbox Docker container directly from the browser. It uses xterm.js with a WebSocket-based PTY connection, giving you a real Kali Linux terminal with all pre-installed pentesting tools.
Architecture
Browser (xterm.js) → WebSocket → Agent proxy (/ws/kali-terminal) → kali-sandbox terminal server (port 8016) → PTY /bin/bash
Features
| Feature | Description |
|---|---|
| Full PTY | Interactive bash shell with command history, tab completion, arrow keys, Ctrl+C, etc. |
| Dark theme | Ayu-inspired color scheme with custom prompt (redamon@kali) |
| Connection status | Real-time indicator: Connected (green), Connecting (yellow pulse), Disconnected (grey), Error (red) |
| Auto-reconnect | Exponential backoff (2s, 4s, 8s, 16s, 32s) up to 5 attempts on disconnect |
| Fullscreen | Toggle fullscreen mode for immersive terminal use |
| Reconnect | Manual reconnect button (disabled during connection attempts) |
| Keepalive | Browser-side ping every 30 seconds to prevent idle disconnects |
| Resize sync | Terminal dimensions automatically sync with window size via ResizeObserver |
Use Cases
- Manual tool execution — run Metasploit, Nmap, Hydra, sqlmap, or any Kali tool directly
- Debugging — inspect the sandbox environment, check processes, review logs
- Scripting — write and execute custom scripts inside the container
- Supplementing the agent — perform manual steps the AI agent cannot or should not automate
Note: This tab provides direct sandbox access. For managing remote sessions opened by the AI agent (meterpreter, reverse shells, etc.), use the Reverse Shell tab instead.
redagraph CLI (in-terminal graph queries)
redagraph is a small command-line tool installed on the kali-sandbox image and reachable from the RedAmon Terminal tab. It lets you query the project's Neo4j attack-surface graph from inside the shell, with the active user_id and project_id automatically injected into every query so cross-tenant data is never returned.
The point of redagraph is to close the loop between what the recon pipeline already discovered and what you want to throw a Kali tool at next. Instead of opening the Graph view, copying URLs or IPs by hand, and pasting them into a tool, you run a one-liner:
redagraph ls Subdomain | httpx -title -status-code
redagraph ls IP -a address | naabu -p 1-65535
redagraph ls Endpoint -a baseurl > urls.txt && nuclei -l urls.txt -t cves/
redagraph cypher 'MATCH (s:Subdomain)-[:RESOLVES_TO]->(i:IP) RETURN i.address' | sort -u | masscan -iL - -p 80,443
Every Kali tool that reads targets from stdin or a file becomes a first-class consumer of the graph.
Why this matters for manual testing
The recon pipeline produces a rich graph (Subdomain, IP, Port, Service, Technology, Endpoint, BaseURL, Header, DNSRecord, CVE, Vulnerability, Secret, ...) with all the relationships between them. When you want to manually test a single Kali tool against a real subset of that graph, redagraph is the bridge:
Without redagraph | With redagraph |
|---|---|
| Open Graph view, filter by node type, copy each value, paste into a target list | redagraph ls <NodeType> -a <attr> produces the list directly |
Write a Cypher query in the Graph AI assistant, re-type it in cypher-shell, hand-strip the tenant filter | Run the same Cypher with redagraph cypher '...' (tenant filter is silent and automatic) |
| Risk hitting the wrong target (other project's data) | Cross-project isolation is enforced by the CLI, not by you remembering it |
| No piping into Kali tools | Native pipe support; output composes with grep/sort/uniq/awk/jq/wc and shell redirection |
Concretely, this is what manual workflows look like:
# Run httpx only against subdomains the recon pipeline marked as live (status_code is set)
redagraph cypher \
  'MATCH (s:Subdomain) WHERE s.status_codes IS NOT NULL RETURN s.name' \
  | httpx -silent -tech-detect

# Run sqlmap against every endpoint that recon flagged with query parameters
redagraph cypher \
  'MATCH (e:Endpoint) WHERE e.query_string <> "" RETURN e.url' \
  | xargs -I{} sqlmap -u {} --batch --level 2

# Pre-filter ffuf wordlist pass to only subdomains that resolve to the same /24 as a known IP
redagraph cypher \
  'MATCH (s:Subdomain)-[:RESOLVES_TO]->(i:IP) WHERE i.address STARTS WITH "203.0.113." RETURN s.name' \
  | xargs -I{} ffuf -u https://{}/FUZZ -w common.txt

# Feed nuclei a hand-crafted target list from BaseURLs that have a specific technology
redagraph cypher \
  'MATCH (b:BaseURL)-[:USES]->(t:Technology {name: "WordPress"}) RETURN b.url' \
  > wp-targets.txt
nuclei -l wp-targets.txt -tags wordpress
Because tenant scoping is silent, you can move between projects (top-right project switcher) and the same exact one-liner now points at a different scope without any code change. That is the primary value over running raw cypher-shell against Neo4j: you stop carrying tenant state in your head.
Invocation
redagraph [global options] <subcommand> [subcommand options]
The shell only reads REDAMON_USER_ID and REDAMON_PROJECT_ID from the environment. These are injected automatically when you open the terminal via the webapp Graph -> Terminal tab (the browser sends them as the first WebSocket frame, and the sandbox PTY forks the shell with them set). A docker exec-spawned shell does not have them, so redagraph exits with a hint.
Global options
| Flag | Default | Effect |
|---|---|---|
-h, --help | Print help. Available on the top level and on each subcommand. | |
-f, --format {plain,json,tsv} | plain | Output format. plain emits one value per line for single-column results, falls back to TSV for multi-column. json emits NDJSON (one JSON object per record), suitable for jq. tsv emits a header + tab-separated values. |
-o, --output FILE | (stdout) | Write to FILE instead of stdout. Equivalent to > FILE; provided for shells where redirection is awkward. |
Subcommands
| Subcommand | Purpose | Required | Optional |
|---|---|---|---|
whoami | Print the active user_id / project_id and the Neo4j and agent endpoints redagraph is configured to use. | ||
types | List the distinct node labels that have at least one node in the active project. Tenant-scoped via explicit WHERE n.user_id=... AND n.project_id=.... | ||
schema | Dump the live Neo4j schema (labels, relationships, indexes, constraints) by calling db.schema.visualization(). The schema is database-wide, not tenant-specific (it describes structure, not data). | ||
ls <NodeType> | List every node of a given label, emitting one attribute per line (default: name). | <NodeType> (label, e.g. Subdomain) | -a <attr> (attribute to emit, default name); --limit N (cap rows; 0 = unlimited) |
cypher <query> | Run a literal Cypher query. The CLI rejects writes (CREATE, MERGE, DELETE, SET, REMOVE, DROP, GRANT, LOAD CSV, apoc.create.*, apoc.cypher.runWrite, dbms.*, etc.) and refuses queries with no labelled node patterns (since the inline tenant filter cannot scope them). | <query> (single-quoted Cypher) | |
ask <question...> | Natural-language question. Calls the agent's /text-to-cypher endpoint with for_graph_view=false (so the LLM is free to RETURN scalar properties), then runs the generated Cypher with the tenant filter applied. Multiple words are joined automatically: redagraph ask domain list works without quotes. | <question...> (one or more words) | --show (print the generated Cypher to stderr, prefixed with #) |
Tenant scoping (what happens under the hood)
For every Cypher query, redagraph:
- Rejects writes via a static regex check (read-only enforcement, local).
- Rewrites every labelled node pattern
(d:Domain {...})into(d:Domain {..., user_id: $tenant_user_id, project_id: $tenant_project_id})so the query can only match nodes owned by the current(user_id, project_id). - Refuses queries that have no labelled node patterns (e.g.
MATCH (n) RETURN n), because the inline rewrite cannot reach them and the query would otherwise leak cross-tenant data.redagraph typesis the documented exception, since it filters explicitly withWHERE. - Passes
tenant_user_idandtenant_project_idas parameters to Neo4j.
You never type the tenant filter, and you cannot accidentally query a different project from the terminal. To target a different project, switch projects in the top-right project switcher; the terminal reconnects with the new tenant context.
Output formats
plain (default) is designed to compose with the rest of the shell:
| Result shape | Plain output |
|---|---|
| Single column of scalars | One value per line. Empty values produce empty lines. |
| Single column of nodes | One line per record, formatted as key=value key=value ... so all properties are visible. (Use -f json if you want machine-parseable structure.) |
| Multiple columns | Header on stderr, TSV rows on stdout, so pipes stay clean: `redagraph cypher '...' |
json always emits NDJSON (one JSON object per row). Nodes and relationships are converted to {"_kind":"node","labels":[...],"properties":{...}} so they survive the trip to text.
tsv adds a header row to stdout and uses tab separators.
Examples
Listing things you want to feed into Kali tools
# All subdomains, one per line
redagraph ls Subdomain

# All Endpoint baseurls into a file, then nuclei them
redagraph ls Endpoint -a baseurl > urls.txt
nuclei -l urls.txt -t exposures/ -t misconfiguration/

# Just the IPs that have at least one open port
redagraph cypher 'MATCH (i:IP)-[:HAS_PORT]->(p:Port) RETURN DISTINCT i.address' \
  | naabu -p 80,443,8080,8443

# Endpoints with query strings, ready for parameter fuzzing
redagraph cypher 'MATCH (e:Endpoint) WHERE e.query_string <> "" RETURN e.url' \
  | head -50 \
  | xargs -I{} ffuf -u "{}&FUZZ=test" -w params.txt
Counting and aggregating
# How many subdomains have we discovered
redagraph ls Subdomain | wc -l

# How many distinct Technology names show up across all BaseURLs
redagraph ls Technology | sort -u | wc -l

# Open-port distribution
redagraph cypher 'MATCH (p:Port) RETURN p.number AS port, count(*) AS n ORDER BY n DESC'
Joining graph data with Kali tool output
# Diff: which discovered subdomains do NOT respond to httpx?
redagraph ls Subdomain > all-subs.txt
httpx -l all-subs.txt -silent | sed 's|https\?://||;s|/.*||' | sort -u > live-subs.txt
comm -23 <(sort -u all-subs.txt) live-subs.txt > dead-subs.txt
echo "$(wc -l < dead-subs.txt) subdomains in the graph but not responding"

# Filter nuclei runs to only versions of nginx the graph claims are vulnerable
redagraph cypher 'MATCH (t:Technology {name: "nginx"})-[:HAS_CVE]->(c:CVE) RETURN c.cve_id' \
  | sort -u > our-nginx-cves.txt
nuclei -l urls.txt -tags cve | grep -F -f our-nginx-cves.txt
Natural-language exploration
# Whatever the LLM thinks "list all the CVEs we know" means
redagraph ask list all CVEs

# Show the generated Cypher (good for prompt debugging or learning the schema)
redagraph ask --show subdomains with status 200

# Pipe NL output into a tool. JSON keeps the structure if the LLM picked nodes.
redagraph -f json ask all endpoints with a query string \
  | jq -r '.e.properties.url'
Output formats side by side
redagraph ls Subdomain --limit 3                           # plain
# a.example.com
# b.example.com
# c.example.com

redagraph -f json ls Subdomain --limit 3                   # NDJSON
# {"name": "a.example.com"}
# {"name": "b.example.com"}
# {"name": "c.example.com"}

redagraph -f tsv cypher 'MATCH (s:Subdomain) RETURN s.name AS name, s.status AS status LIMIT 2'
# name  status
# a.example.com  200
# b.example.com  no_http
Exit codes
| Code | Meaning |
|---|---|
| 0 | Success |
| 2 | Argument or usage error (missing tenant env, invalid label/attr, -o cannot open file, argparse failure) |
| 3 | Query rejected (write operation, or no labelled node patterns to scope) |
| 4 | Agent unreachable or /text-to-cypher returned an error (only relevant for ask) |
Troubleshooting
| Symptom | Cause / fix |
|---|---|
redagraph: no active project. Open the terminal via the webapp Graph -> Terminal tab so the project context is set. | The shell was opened via docker exec instead of the webapp, so REDAMON_USER_ID / REDAMON_PROJECT_ID are missing. Open the terminal from the webapp, or export them manually for testing. |
redagraph: write operation rejected (CREATE). This CLI is read-only. | Working as intended. The CLI does not allow mutations. Use the agent or the webapp graph view if you need to write. |
redagraph: query has no labelled node patterns; tenant filter cannot scope it. | Add a label, e.g. MATCH (n:Subdomain) .... Anonymous matches are blocked because they would silently bypass tenant scoping. |
redagraph: cannot reach agent at http://agent:8080 | Only affects ask. The agent container is down or unreachable from the sandbox network. Check docker compose ps agent. |
redagraph ask returns whole nodes instead of names | The LLM did not narrow the projection. Either rephrase ("only the names"), or use redagraph ls <Type> / redagraph cypher 'MATCH (...) RETURN x.name'. |
Graph Canvas
The graph canvas is the main visualization area where your attack surface is displayed as an interactive node-link diagram.
2D Mode
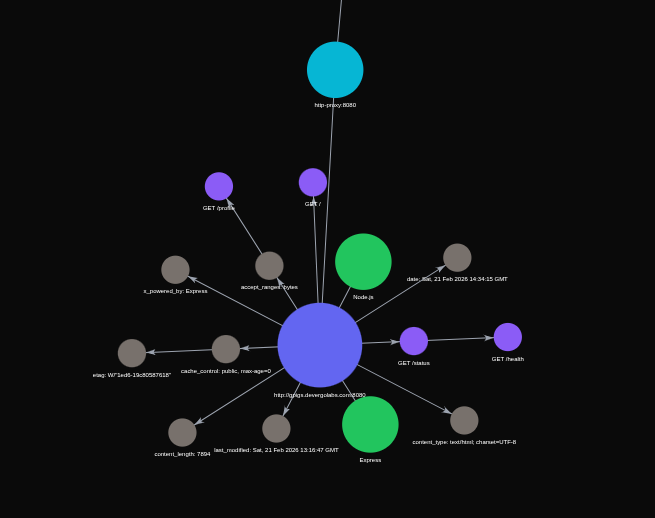
- Pan: Click and drag the background
- Zoom: Mouse scroll wheel
- Select node: Click on any node to open the Node Drawer
- Nodes are color-coded by type (see Bottom Bar)
- Nodes are positioned by a force-directed layout algorithm
3D Mode
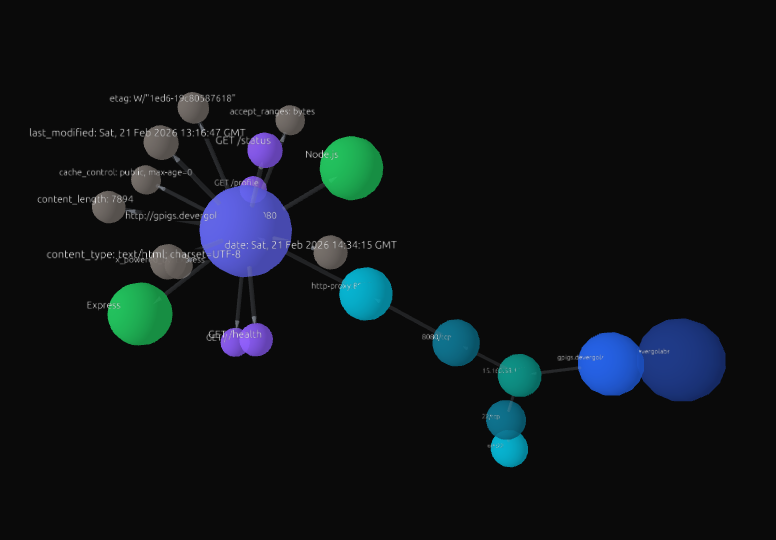
- Rotate: Click and drag
- Pan: Right-click and drag
- Zoom: Mouse scroll wheel
- Select node: Click on any node
- Provides a more immersive view for large graphs
Auto-Refresh
During active reconnaissance, the graph auto-refreshes every 5 seconds to show new nodes as they're discovered. The refresh stops when the scan completes.
Data Table
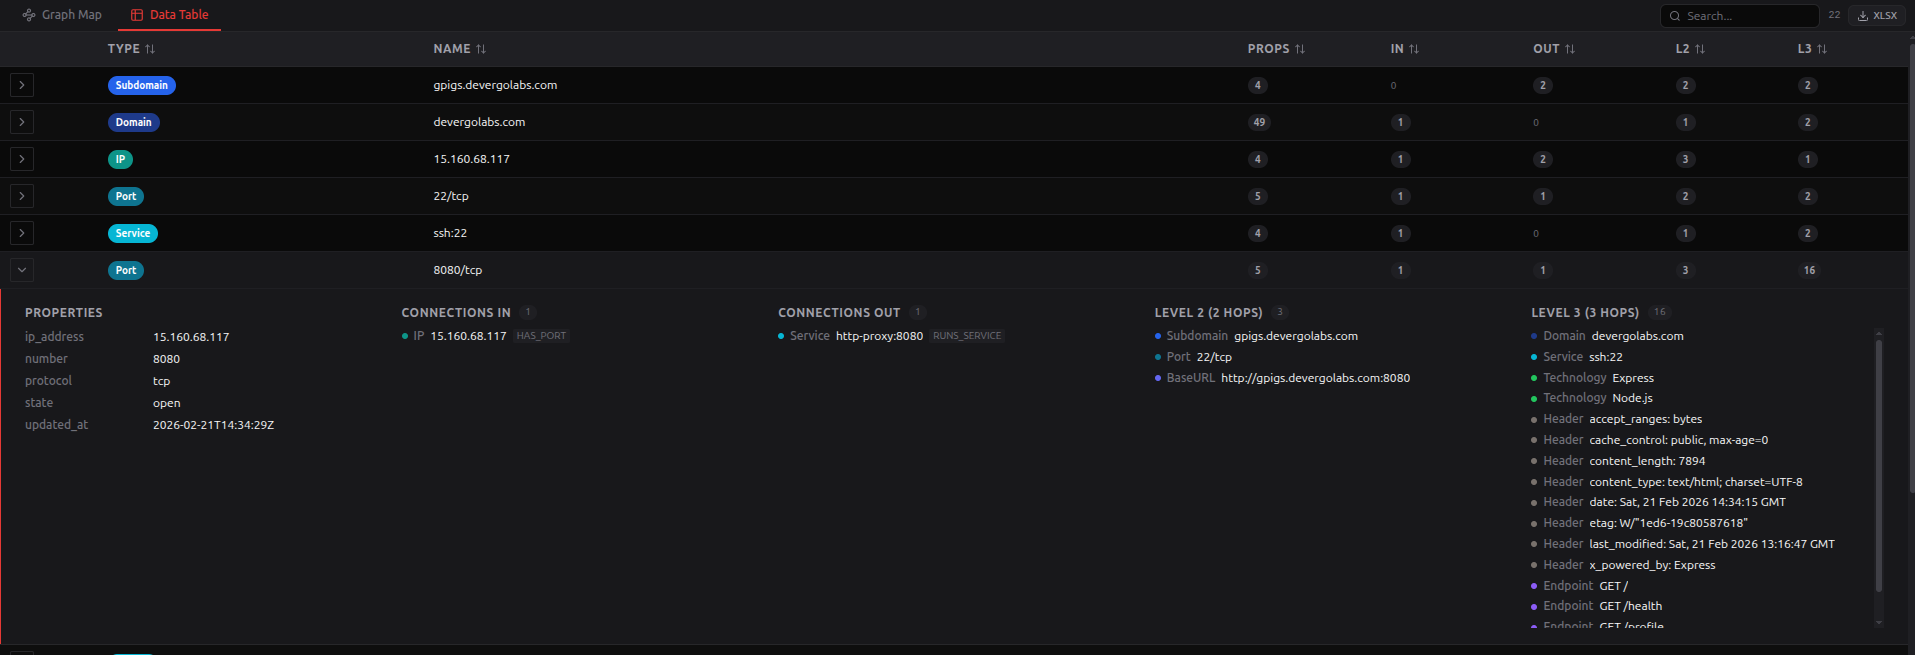
The Data Table tab opens a dropdown with 20 presets: 3 base views plus 17 Red Zone finding tables. Every preset shares the same shell: per-table search, refresh, and three export buttons (XLSX, JSON, MD) in the header; paginated scroll body. The active search filter applies to exports - only matching rows are written.
Default preset: Node Inspector is selected the first time you open the Data Table tab — it's the most common entry point for one-type-at-a-time exploration. You can switch to any other preset from the dropdown; your last-selected preset is not yet persisted across reloads.
Base views
| # | Entry | Icon | What it is |
|---|---|---|---|
| 1 | Node Inspector | Layers | Per-type attribute browser. Pick one node type at a time and see every property as its own sortable column. Column visibility is per-user, per-node-type, persisted in the DB. |
| 2 | All Nodes | Table2 | Flat list of every node in the graph. Row-expand shows all node properties. Filtered by node type via the bottom-bar legend. |
| 3 | JS Recon | Code | Full JS reconnaissance dataset with sub-tabs: Secrets, Endpoints, Dependencies, Source Maps, Security, Attack Surface. |
Node ID and Mute columns
Every node table — the three base views above and the Red Zone finding tables below — carries two extra columns:
| Column | Where | What it does |
|---|---|---|
| Node ID | Leftmost, always shown | The node's internal graph id: id(n) in Cypher, the same number the Node Drawer shows. Click it to copy. It is the handle for pointing at a row from outside the table: paste it to the AI Agent or an external agent connected over MCP ("what is node 1234 connected to?"). It is carried into the table exports too. |
| Mute | Rightmost | The same Mute as the Priority Board: hides a noisy finding from the graph, reports and the agent, restorable from Muted Nodes. Only findings can be muted — on an asset row (IP, domain, port, technology…) the button is disabled and its tooltip says why. It is also disabled while you view a saved version, which is read-only. Next to it, Multi mutes this finding and others like it in one go, from AI suggestions you confirm; see Multi mute. |
A Node ID is for pointing, not for storing. A rescan, an import or a version activation deletes and recreates nodes, and Neo4j reuses freed ids, so an id is only good for the graph as it is now. Don't save it in notes or tickets as a permanent reference.
Where a row is not itself an addressable node, the Node ID points at the project node that holds it. CVE nodes are shared across projects, so the Kill-Chain Explorer shows the id of the Technology carrying the CVE.
Node Inspector — in detail

Why it exists. "All Nodes" is great for a flat overview but every property is buried inside an expandable row. Node Inspector flips that: pick one type, get a wide table where every attribute is a first-class column you can sort, copy, and export. It's the fastest way to answer questions like "show me all Vulnerability rows with their cwe_id, severity, and description side-by-side" or "list every Domain with its WHOIS registrar and country".
Toolbar (top of the panel).
| Control | Behavior |
|---|---|
| Search (left) | Filters visible rows by node name OR any property value (case-insensitive substring). Honored by exports — only matching rows are written. |
| Row count badge | Shows filtered/total rows for the selected type. |
| CSV / JSON / MD buttons | Download the current view (filtered + visible columns only). Filename pattern: redamon-<nodetype-slug>-<YYYY-MM-DD-HH-MM-SS>.{csv|json|md}. |
| Type selector (right, with colored swatch) | Single-select dropdown listing every node type present in the current graph data, sorted alphabetically with per-type counts. Defaults to the first type alphabetically. |
Columns menu (right, badge shows visible/total) | Multi-toggle popover with one checkbox per hideable column, plus Show all / Hide all. Toggling persists to the DB (debounced 400 ms). |
Column model.
| Position | Column | Hideable | Source |
|---|---|---|---|
| 1 | Expand chevron | No | Opens the same expanded-row detail used by All Nodes (full property list + connections in/out + 2-hop / 3-hop). |
| 2 | Node ID | No | The node's graph id, pinned leftmost. Click to copy. See Node ID and Mute columns. |
| 3 | Name | No | Node name. Rendered as a clickable external link when the node is web-addressable (Domain/Subdomain → https://, IP → http://, anything with an explicit url/endpoint/href property → that URL). |
| 4 ... N | Dynamic property columns | Yes | One column per property key found across at least one node of the selected type, sorted alphabetically. Internal scoping fields (project_id, user_id) are always excluded. |
| N + 1 | In | Yes | Count of incoming graph relationships. |
| N + 2 | Out | Yes | Count of outgoing graph relationships. |
| N + 3 | Updated | Yes | When the node was last written. |
| N + 4 | (Mute) | No | The row's Mute button. See Node ID and Mute columns. |
Auto-linkified cells. Property values that match known patterns are rendered as external links automatically — URLs (pass-through), IPs (→ http://<ip>), hostnames (→ https://<host>), CVE IDs (→ NVD detail), CWE IDs (→ MITRE), CAPEC IDs (→ MITRE), emails (→ mailto:), GitHub owner/repo slugs (→ github.com), host:port (→ http://host:port). Plain words (e.g. registrar names like GoDaddy) and file names (e.g. config.xml) stay as text — there's a deny-list for common file extensions to avoid false positives.
Persistence. Hidden-column selections are stored on the User row in Postgres under uiPreferences.nodeDetailsTable.<NodeType>.hiddenColumns (only the HIDDEN keys are stored, so a newly discovered property defaults to visible without any DB write). Selections are per-user AND per-node-type — hiding country on Domain doesn't affect IP. All three Show all / Hide all / single-toggle actions persist via the same debounced PATCH so a rapid burst of clicks produces one network write.
Behavior with empty/missing data.
- A type with zero rows after filtering shows the empty pagination state — the type selector and Columns menu remain operative.
- A property that exists on only ONE node of the type still appears as a column (rows lacking it show empty).
- A previously-hidden column that no longer appears in the current data is silently kept in the saved hidden list — preserves intent if the property returns later.
Red Zone finding tables
Every table below is a graph-native aggregation driven by a single Cypher query. Rows represent actionable pentesting findings, not raw nodes.
4. Kill-Chain Explorer (Target icon)
Row = one attack path. Walks Subdomain -> IP -> Port -> Service -> Technology -> CVE -> MitreData -> Capec, flags a KEV badge when an ExploitGvm node links the CVE. Sorted CISA-KEV first, then max CVSS. Empty until nmap + nuclei vuln_scan + CVE enrichment have run.
5. Technology Blast Radius (Zap icon)
Per-Technology aggregate: CVE count, max CVSS, KEV count, number of BaseURLs / IPs / subdomains transitively affected by that version. Converts scattered CVE nodes into a patch-priority queue. Empty until Technology nodes have linked CVE nodes.
6. Subdomain Takeover (Flag icon)
Every Vulnerability{source='takeover_scan'} with verdict (confirmed / likely / manual_review), provider (github-pages, heroku, aws-s3, fastly, ...), CNAME target, confidence score, evidence snippet, and the tool sources that detected it (subjack, nuclei, baddns). Sorted confirmed -> likely -> manual_review. Empty until Subdomain Takeover Detection has run.
7. Secrets & Credentials (Key icon)
Every :Secret node whether attached via BaseURL-[:HAS_SECRET]-> (resource_enum) or JsReconFinding{js_file}-[:HAS_SECRET]-> (js_recon). Columns: secret type, key category, redacted sample, entropy, validation status (validated / format_validated / unvalidated), detection method, source URL, subdomain. Sorted validated > format_validated > unvalidated, then by type priority. Empty until js_recon or resource_enum has discovered credentials.
8. Net Initial-Access (Server icon)
Merges (a) open sensitive ports (SSH, RDP, SMB, SMTP, MySQL, Postgres, MSSQL, Mongo, Redis, Elasticsearch, K8s API, VNC, etc.) with (b) network-layer security_check vulnerabilities (direct_ip_http, direct_ip_https, waf_bypass, redis_no_auth, database_exposed, kubernetes_api_exposed, smtp_open_relay). Joins each (IP, Port) to its subdomains and ASN/country/CDN metadata. Empty until port_scan + security_checks have run.
9. GraphQL Risk Ledger (Boxes icon)
Every Endpoint{is_graphql=true} with its graphql-scan flags (introspection, graphiql_exposed, field_suggestions_enabled, GET-allowed, batching, tracing), operation counts (queries / mutations / subscriptions), schema hash, sensitive-field sample, and linked graphql_scan / graphql_cop vulnerabilities. Sorted introspection-enabled first. Empty until graphql_scan has run.
10. Web Initial-Access (LockKeyhole icon)
Per-BaseURL view of auth / admin endpoints (/login, /admin/*, category = auth / admin / login), with a present/missing grid for six security headers (CSP, HSTS, X-Frame-Options, X-Content-Type-Options, Referrer-Policy, Permissions-Policy), linked web-layer vulnerabilities (login_no_https, basic_auth_no_tls, session_no_secure, session_no_httponly, cache_control_missing, csp_unsafe_inline, insecure_form_action, no_rate_limiting), and an A-to-F grade. Empty until http_probe + resource_enum + security_checks have run.
11. Parameter Matrix (Bug icon)
Every :Parameter{is_injectable=true} or any Parameter reached by a Nuclei DAST finding via AFFECTS_PARAMETER. Columns: parameter name, position (query / body / header / cookie / path / form), endpoint path, method, linked vulnerability, template_id, matcher_name, fuzzing_method/position, CVSS, matched_at URL. Empty until vuln_scan fuzzing has produced DAST findings.
12. Shared Infrastructure (Network icon)
Three cluster kinds unified into one table: Certificate SAN overlap (same cert serves multiple hostnames), ASN grouping (multiple IPs under the same autonomous system), origin-IP sharing (multiple subdomains on the same IP). Surfaces cross-tenant attack pivots and scope-creep during external engagements. Empty until http_probe has collected Certificate nodes and port_scan has enriched IP ASN.
13. DNS & Email Posture (Mail icon)
One row per Domain: SPF presence + strictness (-all vs ~all vs +all), DMARC presence + policy (reject / quarantine / none), DNSSEC enablement, zone-transfer open flag, MX and NS records, WHOIS registrar + contact emails, days-to-expiry, VT / OTX reputation. Missing-flags derived from TXT-record absence AND spf_missing / dmarc_missing / dnssec_missing / zone_transfer security-check vulns. Empty until domain_recon + WHOIS + security_checks have run.
14. Threat Intel Overlay (ShieldAlert icon)
Unified Domain and IP view with any threat-intel signal: VT malicious / suspicious / reputation / JARM / tags, OTX pulse count + adversaries + malware families + ATT&CK IDs + TLP, CriminalIP risk grade (domain) or score + Tor/VPN/proxy/darkweb/hosting/scanner flags (IP), plus ThreatPulse and Malware linkage counts. Sorted by pulse count desc, VT malicious desc. Empty until OSINT enrichers (otx_enrich, virustotal_enrich, criminalip_enrich) have run.
Since 6.10.0 the table has a third kind of row. Alongside Domain and IP rows
(where the asset itself is the indicator) it lists BaseURL rows, where your
target was observed contacting a third-party host that a published
supply-chain incident names. Those rows fill the Contacted host column and
carry the incident id, status, summary and attack vectors; the VT / OTX /
CriminalIP columns are empty on them because they are a different kind of claim.
The two are kept apart in the graph by the edge type - APPEARS_IN_PULSE versus
CONTACTS_MALICIOUS_HOST - so a supply-chain incident can never masquerade as
"your host is a known threat indicator". Populate the catalog with
./redamon.sh sca-intel-sync; see
Supply-Chain Scanning.
15. JS Dep Signals (Package icon)
Called Supply-Chain before the package/OSV feature took that name. Same table, same data, same
supplyChainAPI slug. If you have a bookmark to/graph?table=supplyChain, it still resolves here.
JsReconFinding nodes with supply-chain impact, all of them about the build and the artifacts it ships, not about the packages themselves: dependency_confusion (a bare import specifier that does not exist on public npm, so an attacker can register it), source_map_exposure + source_map_reference (reachable .map files leaking original sources), framework (React / Vue / Angular version disclosure), dev_comment (leaked internal comments and TODOs), cloud_asset (S3 / GCS / Azure blob URLs leaked in client code). Columns preserve package name, version, cloud provider/type, evidence, and parent JS file URL. Empty until js_recon has run with these scanners enabled.
Package and Version were blank on every row until 2026-08. They read
name/version, which the js_recon writer never set. It now storespackage_name/package_version(deliberately notname, which is what the graph viewer displays as the node label, and writing it there would relabel every framework node from "React 18.2.0" to "React"). The query coalesces, so rows written before the fix still render. Re-run js_recon to populate the columns on existing findings.
For malicious or vulnerable packages (MAL- verdicts, CVE/GHSA advisories, GuardDog behaviour) see Supply-Chain SCA below.
16. Historic DNS Drift (History icon)
Per-Domain temporal view combining OTX passive-DNS history (HISTORICALLY_RESOLVED_TO edges with first_seen, last_seen, record_type), :ExternalDomain sightings from redirect chains (sources, times_seen, countries_seen, redirect_from_urls), and dangling :Subdomain nodes (has_dns_records=false or status='no_http'). Derives ASN drift and country drift by diffing historic vs current resolutions. Empty until OSINT enrichment and domain_recon have both run.
17. AI / LLM Attack Surface (Bot icon)
In the dropdown this preset sits directly after JS Recon, grouped with the discovery views.
Multi-sheet inventory of every AI / LLM / MCP / vector-DB surface, aggregating AI enrichment from all modules (http_probe AI header/title/favicon, port_scan AI port catalogue, resource_enum AI classifier, js_recon AI SDK, and the central ai_surface_recon module). Sub-sheets:
- LLM Endpoints — every
Endpointwithai_interface_typeset oris_ai_framework_detected: interface type (llm-chat / llm-completion / sse-stream / mcp), streaming / tools / vision support, model family, p50 latency, RAG-ingest flag, framework name, and detection source. - MCP Servers —
Endpoint{ai_interface_type='mcp'}: server name/version, protocol version, tool / resource / prompt counts, capabilities, auth-required, and the rug-pulltools_hash. - AI Technologies —
Technology{categorystartsai-}: name, category (ai-runtime / ai-frontend / ai-proxy / ai-sdk-client / ai-framework / ai-vector-db), version,detected_by(httpx-ai-header / httpx-ai-title / naabu-ai-port / ai-surface-recon-julius / ai-surface-recon-probe), and attach count. - Vector DBs — confirmed
ai-vector-dbTechnologies with host, port, and detection source (Chroma / Qdrant / Weaviate / Milvus). - Model Inventory — flattened
ai_model_ids(model id, family, source endpoint) discovered from/v1/models+/api/tags.
Empty until a scan with AI awareness enabled (or the AI / LLM Surface Recon preset) has run.
18. AI Risk (OWASP-LLM / ATLAS) (Radiation icon)
In the dropdown this preset sits directly after AI / LLM Attack Surface.
Multi-sheet offensive view of the attackable AI findings, mapped to OWASP LLM Top-10 / MITRE ATLAS. Sub-sheets:
- MCP Tool Poisoning —
Vulnerability{source='ai_surface_recon'}: type (mcp_tool_poisoning/mcp_data_exfiltration/mcp_annotation_mismatch/ ...), severity,ai_owasp_llm_id,ai_atlas_technique, payload class, the MCP endpoint, and evidence. - Injectable Params —
Parameter{is_ai_prompt_injectable=true}with endpoint, base URL, and resolvedai_tool_arg_path(the prompt-injection entry points). - RAG Ingestion —
Endpoint{is_ai_rag_ingest=true}: the indirect-prompt-injection sink endpoints. - Exposed Runtimes —
ai-runtime/ai-proxyTechnologies reachable onhost:port(Ollama / vLLM / TGI / LiteLLM / gateway exposure). - Unauthenticated MCP — MCP servers with
ai_mcp_auth_required=false. - AI Gauntlet Vulnerabilities —
Vulnerability{source IN ['garak','pyrit','giskard','promptfoo']}written by the AI Gauntlet offensive scan: tool, severity,ai_owasp_llm_id, attack chip, target endpoint, ASR, trials, payload class (e.g.garak-dan,pyrit-crescendo), and the transcript reference. These are the confirmed, payload-tested AI weaknesses, as opposed to the statically inferred MCP findings in the rows above.
The first five sub-sheets are empty until the AI Surface Recon module has run; the AI Gauntlet Vulnerabilities sheet fills in after an AI Gauntlet scan.
19. Web Cache Poisoning (Droplets icon)
Every Vulnerability{source='cache_poisoning'} written by the Web Cache Poisoning module, linked to the affected Endpoint / BaseURL. One row per confirmed poisoning, sorted by CVSS then confidence. Columns:
- Endpoint — the poisonable URL.
- Unkeyed input — the request component the cache ignores but the origin trusts: a header (
X-Forwarded-Host,X-Forwarded-Proto,X-Forwarded-Port,X-Host,Forwarded, client-IP headers, …) or a?param(parameter cloaking, e.g.utm_source). - Impact —
stored_xss(critical),open_redirect,dos(CPDoS),reflected, ordeception. - Sev / CVSS — severity badge + score.
- Tier — confidence tier (
Confirmed/Strong/Tentative); only findings at or above the project's min-confidence are persisted. - Mode — how it was proven:
reflected(benign canary echoed),differential(a persisted status / Location / body change with no echoed marker), orboth. - Conf — the 0–1 confidence score.
- PoC — a clickable link to the poisoned cache-buster slot, with the ready-to-run
curl(canary header + busted URL) in the tooltip.
The header summary shows N Confirmed · N critical · N total. Empty until Web Cache Poisoning is enabled in project settings and a scan has run.
20. Supply-Chain SCA (PackageSearch icon)
In the dropdown this preset sits directly after JS Dep Signals, and is flagged NEW.
The malicious- and vulnerable-package view: Package, MalPackageFinding and Vulnerability{source='osv'}, the model that all three layers of the supply-chain feature MERGE into. An uploaded SBOM, a cloned GitHub repo and a live-target recon harvest dedup onto the same purl, so one row can carry evidence from several scans at once. Three sheets:
- Verdicts - one row per
MalPackageFinding. Verdict, severity, advisory or rule (plus OSV aliases), package, version, ecosystem, tool, origin, anchor, title, evidence, and an Incident column that expands into the catalog write-up (summary, status, blast radius, remediation steps, feed revision, link) when the incident catalog matched the package. An empty Incident column means "not in the catalog or never synced", not "safe". - Packages - the inventory, one row per
Package, with rolled-up malicious / suspicious / unchecked / advisory counts and a derived status. - Advisories - one row per
CVE/GHSAthe offline OSV pass matched. Filtered tosource='osv'becauseVulnerabilityis a shared label that GVM, nuclei and the GraphQL scanner also write into.
Three things the table derives rather than reads, all of them about not mistaking absence of evidence for evidence of safety:
| Derived | Why it exists |
|---|---|
Verdict is three-state: malicious / suspicious / not analysed | A soft_error finding means GuardDog never produced a verdict (tarball download failed, time budget exhausted, dispatch error). Rendered as an ordinary low-severity suspicious hit, an unchecked package reads as a mildly dodgy one. |
unverdictable package status, plus an unversioned (unchecked) count in the header | osv-scanner needs a version to match a version-specific advisory. Source-map and import mining yield names with no version, so those packages were never checked at all. A short verdict list next to a large unversioned count means "mostly unchecked", not "mostly clean". |
Origin: L1 repo / L1 SBOM / L2 live | The layer that found the package is not stored on the node; it is inferred from the anchor (GithubRepository, none, or BaseURL). |
Sheets are capped (1000 verdicts, 2000 packages/advisories) while the header counts are computed over the whole graph, so a capped sheet is labelled SHEET CAPPED rather than quietly presenting a partial list as the total.
Deep-linkable per sheet: /graph?table=supplyChainSca&sheet=advisories. Exports are named supply-chain-sca-<sheet>-<ts>.{xlsx|json|md} (per-sheet, like the AI tables).
Empty until either a Supply-Chain scan has run from Other Scans (SBOM / lockfile upload or a GitHub repo) or a recon scan has run with Supply-Chain Recon enabled. Both need the offline OSV database populated first: ./redamon.sh supply-chain-sync npm.
Bottom Bar (Node Legend & Filter)
The bottom bar displays a scrollable row of color-coded chips, one for each node type present in the graph.
| Feature | Description |
|---|---|
| Color chips | Each node type has a distinct color matching the graph |
| Count badges | Shows how many nodes of each type exist |
| Click to filter | Click a chip to show/hide that node type on the graph |
| All / None | Quick actions to show all or hide all node types |
This is especially useful for large graphs where you want to focus on specific node types (e.g., only Vulnerabilities and CVEs).
Persistence. Your selection (which chips are hidden) is saved to your user account, scoped per-project. Hide
Vulnerabilityhere and it stays hidden when you reload the page; switch to a different project and that project has its own independent selection. Newly discovered node types (e.g.AttackChainappearing after a scan) are auto-shown the first time. The bar itself auto-hides on table modes other than "All Nodes" — Node Inspector and the Red Zone tables don't need it because they have their own type controls.
Other persistent UI state. The Render, 2D / 3D and Labels toggles in the View Tabs are also persisted per-user per-project. The Theme (dark / light) is persisted per-user globally — flipping it on one device follows your account to others.
Node Drawer
When you click on a node in the graph (or a row in the data table), the Node Drawer slides in from the left.
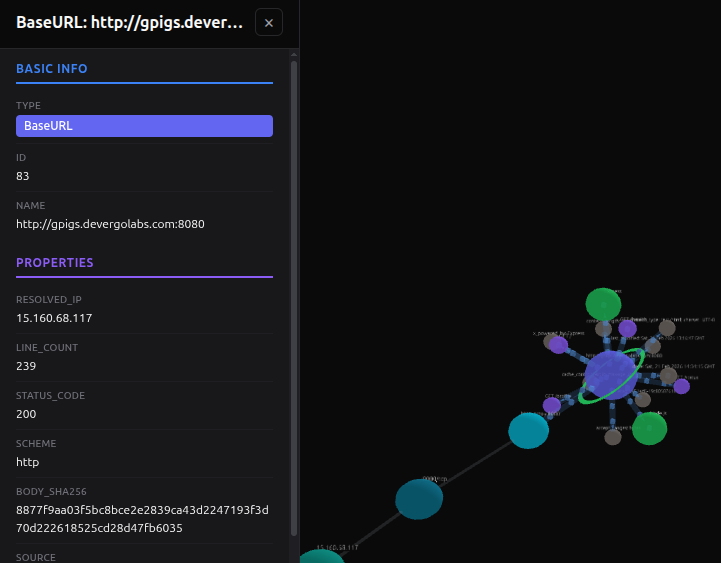
| Element | Description |
|---|---|
| Title | Type: name of the selected node. Shown 30% smaller than other drawers so long names fit; when a name is still too long to fit, it is clipped with … and hovering it shows the full name |
| Type badge | Color-coded label showing the node type (e.g., "Subdomain", "Vulnerability") |
| Node ID | The node's graph id — the same number the tables show in their Node ID column |
| Node name | The display name (e.g., domain name, IP address, CVE ID) |
| Properties | All properties of the node, formatted and labeled |
Internal fields like
project_idanduser_idare hidden automatically.
Basic Info actions
The Basic Info header carries a row of square icon buttons that act on the selected node, left to right:
| Button | Description |
|---|---|
| Copy context (copy icon) | Copies an LLM-ready Markdown description of the node to your clipboard — see below |
| Ask agent (robot icon) | Opens a fresh AI Agent session focused on this node; a modal asks what you want the agent to do, then sends your request together with the node's full context as the first message. See Start a session from a graph node. Hidden while you view a saved version — the agent only ever runs against the active graph |
| Multi mute (left of Mute) | Finds the other findings of the same kind you would mute for the same reason, using your Multi mute model, and lets you mute them together with this one. Not available on assets, on a saved version, on GVM exploits or on JS file containers. See Multi mute |
| Mute (eye-off icon) | Hides a noisy finding from the graph, reports and the agent, exactly as the Priority Board's Mute does; restore it from Muted Nodes. Only findings can be muted — on an asset row (IP, domain, port, technology…) the button is disabled and its tooltip says why. Hidden on a saved version. See Priority Board |
| Delete (trash icon) | Permanently removes the node and its relationships from the graph, after a confirmation. Shown for every node except Domain and Subdomain (the recon roots), and hidden on a saved version |
Copy context (for an external agent)
Copy context puts a self-contained Markdown brief on your clipboard, ready to paste into Claude or any other assistant. It contains:
- a header with the project name and target,
- the node's identity (type, name, graph ID, severity and URL where they apply),
- every property except the hidden internal fields, and
- the node's relationships, written in Cypher-style notation — e.g.
(:Endpoint)-[:USES_TECHNOLOGY]->(this)— with each neighbour's graph ID and URL so same-named nodes stay distinct.
To keep the brief usable as a prompt, a relationship group is capped at 30 neighbours (with an "…and N more" count) and any single property value longer than 4,000 characters is truncated with a note.
Logs Drawer
During any active scan (Recon, GVM, GitHub Hunt, or Secret Multiscanner), a Logs Drawer slides in from the right showing real-time output.
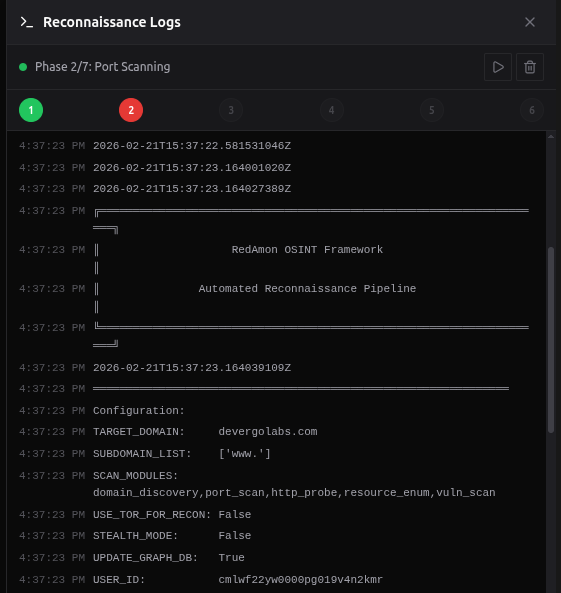
| Element | Description |
|---|---|
| Phase indicator | Shows the current scanning phase (e.g., "Phase 2: Port Scanning") |
| Phase number | Progress through the pipeline |
| Log messages | Real-time streaming of scan output |
| Clear button | Clear the current log display |
Each scan type (Recon, GVM, GitHub Hunt, Secret Multiscanner) has its own independent logs drawer, toggled by the respective "Logs" button in the toolbar or modal. The Secret Multiscanner goes one level finer: its logs are per source, so the drawer is titled with the source being streamed, and its Logs button is enabled only while that source is running. Its phases are Preparing, Scanning and Complete, and credentials are redacted before the output leaves the orchestrator.
AI Agent Drawer
The AI Agent drawer is the most feature-rich panel. It provides a full chat interface for interacting with the autonomous AI agent. See the dedicated AI Agent Guide for a complete walkthrough.
The drawer header also has a folder icon that opens the FileSystem Drawer on the left side of the screen — same drawer as the toolbar folder icon, convenient for dropping files mid-conversation. See Agent Workspace.
FileSystem Drawer
The FileSystem Drawer slides in from the left side of the screen and gives you direct access to the per-project workspace the AI agent is reading and writing — drag-and-drop uploads, breadcrumb file navigation, inline previews with SHA-256 / mode / mtime properties, per-folder tar.gz downloads, and a Jobs tab tracking every background scan the agent has spawned (status badges, log viewing, cancel).
Two entry points open the same drawer:
- The folder icon in the Graph Toolbar Agent Status group.
- The folder icon in the AI Agent Drawer header.
See the dedicated Agent Workspace page for the full operator walkthrough, the four protected default folders (notes/, tool-outputs/, jobs/, uploads/), the 24 fs_* and 5 job_* tools the agent can call, and the auto-offload behavior for huge tool outputs.
Next Steps
Now that you're familiar with the Red Zone, learn how to:
- Run your first reconnaissance to populate the graph
- Use the AI Agent to analyze findings and perform automated pentesting
- Drop files into the Agent Workspace so the agent can read them on its next think step