
MCP Tool Plugins
The MCP Tool Plugins section in Global Settings lets you plug any Model-Context-Protocol (MCP) server into RedAmon's agent — Shodan, GitHub, Burp, your own internal tools — without editing code, rebuilding containers, or running database migrations. Each MCP server you add becomes a tool plugin that extends the agent's tool arsenal. Add one in two clicks via Quick Add presets or a manual form. The tools the plugin exposes are auto-injected into the agent's system prompt and become available in every project's Tool Matrix.
Not the same as Plugins: RedAmon Plugins are optional features an admin installs from the signed plugin catalog on the Plugins page. MCP Tool Plugins, on this page, are MCP servers you connect to the agent from Global Settings.
Naming: a tool plugin is, technically, a Model-Context-Protocol server that the agent connects to. The product term MCP Tool Plugin disambiguates these from the 5 baseline system MCP servers that ship inside the kali-sandbox container (
network_recon,nmap,nuclei,metasploit,playwright) and back the agent's built-in pentest toolset.
Why this matters: RedAmon's agent ships with 25 baseline tools (the 5 system MCP servers wrapping Kali Linux + 7 built-ins). Beyond those, the offensive-security ecosystem has hundreds of MCP servers you can plug in — covering everything from CVE intel to cloud audit to reverse engineering. This page is the operator manual for adding them.
Looking for the technical deep dive? See docs/readmes/README.MCP.md for the protocol-level architecture, the Python schema, the prompt-rendering pipeline, and how runtime tool dispatch works.
Concepts in 60 seconds
| Term | What it is |
|---|---|
| MCP (Model Context Protocol) | An open spec from Anthropic that lets LLMs call tools hosted outside the model. Think "OpenAPI for AI tools" — but designed around JSON Schema, streaming, and three transports (stdio / SSE / streamable_http). |
| MCP server | A process (or HTTP endpoint) that exposes one or more tools. Each tool has a name, description, and inputSchema. |
| System MCP server | One of the 5 baseline MCPs RedAmon ships inside the kali-sandbox container: network_recon, nmap, nuclei, metasploit, playwright. Always available, can't be removed. |
| User MCP server | What you add via this page. Stored per-user in the database (UserSettings.mcpServers JSON). |
| Transport | How the agent talks to the server. stdio = subprocess, streamable_http = HTTP POST, sse = legacy HTTP streaming. |
Where to find it
Open Global Settings (gear icon, top-right of the navbar) → MCP Tool Plugins tab.
You'll see three areas:
- Header — title + the red Add MCP button (top right).
- Quick add — 33 prefilled preset cards in a scrollable grid.
- Saved plugins table — empty until you save your first plugin.

Quick add — the easy path
The 33 preset cards cover the most useful MCP servers (i.e., MCP Tool Plugins) for pentest work, all verified live with correct install commands.
Preset card anatomy
Each card shows:
- Label — short name (e.g. Shodan)
- Category tag — one of
OSINT,Research,Web/HTTP,Security,Utility(top-right of the card) - Blurb — one-line summary
- Transport tag —
stdioorstreamable_http - Auth tag — appears in orange if the preset requires an API key
- Already added tag — appears in green if you've already saved this preset
Hover any card to see the full "why this matters for RedAmon" tooltip — the strategic pentest use case.
Click → form opens prefilled
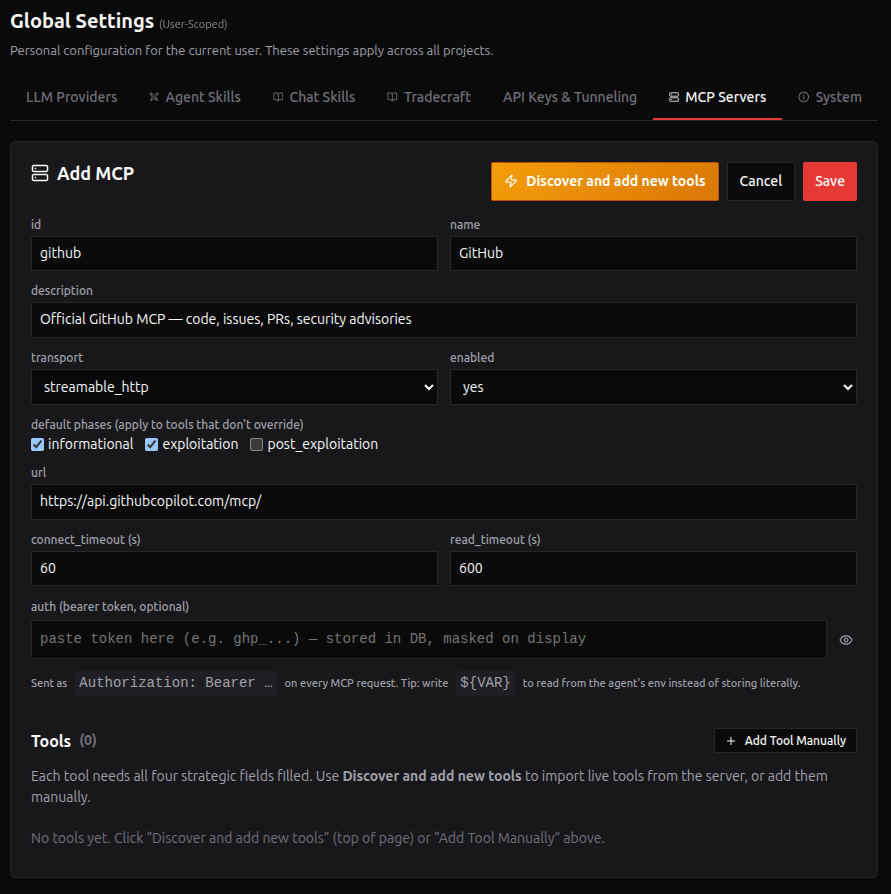
Click a card and the manual form opens with everything filled in except the secret (token / API key). You paste your key, click Test, and Save.
The 33 presets at a glance
Research / Reasoning (4)
| Preset | Auth | Pentest use |
|---|---|---|
| DeepWiki | none | Q&A over any public GitHub repo. Best 0-friction first test. |
| Context7 | optional | Up-to-date library docs while planning attacks |
| Hugging Face | bearer | Security research papers, ML CVE-detection models |
| Wikipedia | none | Neutral context for OSINT background |
OSINT / Search (7)
| Preset | Auth | Pentest use |
|---|---|---|
| GitHub | bearer (PAT) | Code/PR/issue search across all of GitHub |
| Brave Search | env var | Independent OSINT search engine |
| Tavily Search | env var | LLM-tuned web search + extract + crawl |
| Exa Search | env var | Neural / semantic search by meaning |
| DuckDuckGo Search | none | Privacy-friendly, stealth-mode OSINT |
| OSINT Toolkit (badchars) | none + optional | 37 tools: DNS, WHOIS, crt.sh, GeoIP, BGP, Wayback, Hackertarget |
| Hunter.io | bearer | Email enumeration → phishing & AD-username discovery |
Security / Threat Intel (9)
| Preset | Auth | Pentest use |
|---|---|---|
| Shodan | env var | Internet-wide host / port / banner intel |
| VirusTotal | env var | File hash / URL / IP reputation analysis |
| Censys Platform | bearer + X-Org-ID | Internet asset map (alt to Shodan, strong on TLS/cert intel) |
| HaveIBeenPwned (HIBP) | env var | Credential breach lookup → predict valid passwords |
| Threat Intel | env vars | AbuseIPDB + GreyNoise + AlienVault OTX + abuse.ch |
| CVE Intel (extended) | none + optional | NVD + EPSS + CISA KEV + MITRE ATT&CK (27 tools) |
| Snyk | env var | Open-source dependency vulnerability scanning |
| OWASP ZAP | bearer | Active web-app scanner driven by ZAP locally |
| Trivy | none | Container / IaC / OS-package / secret scanner |
Cloud (1)
| Preset | Auth | Pentest use |
|---|---|---|
| Prowler | env vars + Ship CLI | Multi-cloud (AWS/Azure/GCP) audit, 300+ checks |
Web / Browser (2)
| Preset | Auth | Pentest use |
|---|---|---|
| Browserbase | env vars | Cloud browser w/ residential proxies — bypass bot detection |
| mitmproxy | none | Intercept / modify / replay HTTP(S) traffic |
Utility / Reasoning / Reporting (7)
| Preset | Auth | Pentest use |
|---|---|---|
| Memory | none | Persistent knowledge graph across sessions |
| Sequential Thinking | none | Forces structured exploit-chain planning |
| Filesystem | none | Sandboxed file ops in /app/logs/sandbox |
| SQLite | conn-arg | Triage exfiltrated SQLite DBs (Chrome history, mobile apps, password mgrs) |
| PostgreSQL | conn-string | Post-SQLi DB schema / table enumeration |
| Notion | env var | Stream findings into engagement workspace |
| Slack | env vars | Notify team on confirmed vulns / phase transitions |
Reverse Engineering (3)
| Preset | Auth | Pentest use |
|---|---|---|
| GhidraMCP | none | Drive Ghidra for binary disassembly / decompile |
| Stripe | env var (test key) | Test-mode payment fraud / card testing scenarios |
| Linear | bearer | Convert each finding into a Linear issue automatically |
Note: 4 presets need extra setup (
Trivy,Prowler,CVE Intel extended,GhidraMCP) — flagged with a setup hint in their tooltip. Form fields are still pre-populated with the exact command/args that work after the documented setup runs.
Manual Add MCP — full control
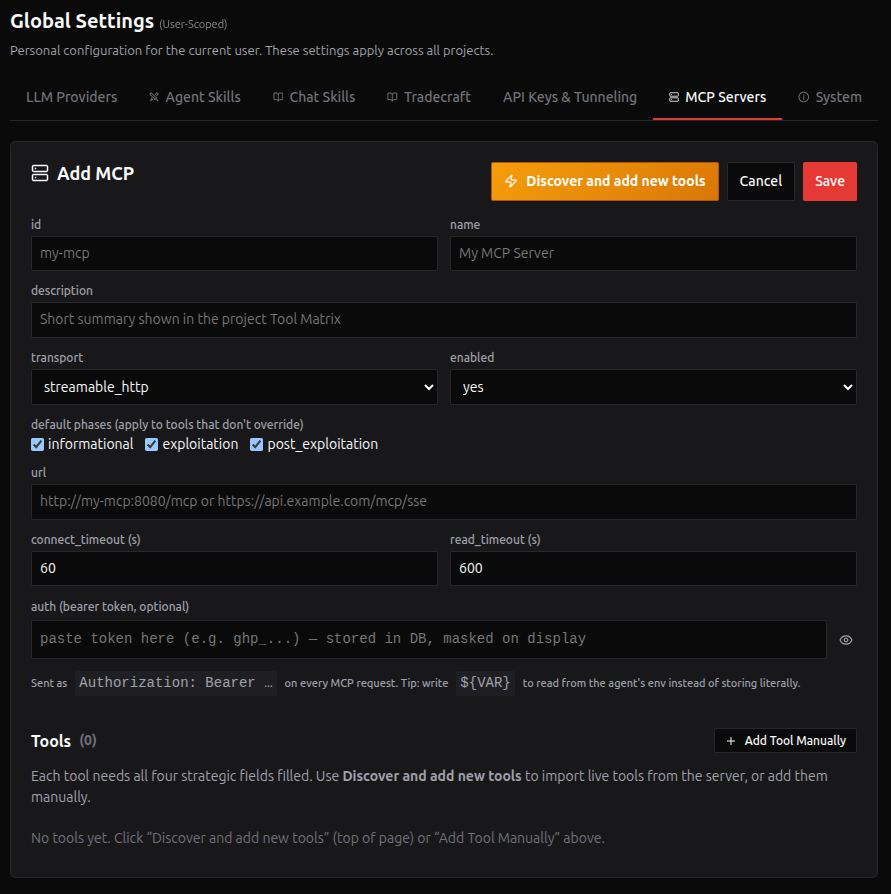
Click the red Add MCP button at the top right when you want to configure a server that isn't in the preset list (your internal MCP, a community fork, a custom build).
Form fields
| Field | Required? | What it does |
|---|---|---|
| id | yes | Unique slug (my-mcp, burp-internal). Immutable after first save. |
| name | yes | Human-readable label shown in the saved-servers table and Tool Matrix. |
| description | no | One-line summary surfaced in the project Tool Matrix and tooltips. |
| transport | yes | streamable_http (recommended for new HTTP MCPs), sse (legacy HTTP), stdio (subprocess). |
| enabled | yes | Master kill-switch. Disabled servers don't load tools or appear in the Tool Matrix. |
| default phases | yes | Default phase availability for the server's tools (informational, exploitation, post_exploitation). Per-tool override is available later. |
Transport-specific fields
When you pick streamable_http or sse:
| Field | Required? | Notes |
|---|---|---|
url | yes | Full URL including scheme (https://mcp.example.com/mcp) |
connect_timeout | optional, default 60s | TCP connect timeout |
read_timeout | optional, default 600s | Idle / SSE read timeout |
auth (bearer token) | optional | Paste the token directly. Stored masked in the DB; never re-displayed. |
When you pick stdio:
| Field | Required? | Notes |
|---|---|---|
command | yes | Binary to launch — npx, uvx, python, docker, etc. |
args | no, but usually yes | One per line. Often -y @some/mcp-package for npx. |
cwd | no | Working directory for the subprocess |
env | no | Key/value env vars passed verbatim to the subprocess. |
Auth: bearer token field (HTTP transports only)
- Paste the literal token (e.g.
ghp_abcd1234...) into the password input. - The token is stored as-is in the DB alongside your other API keys (
UserSettings.tavilyApiKey, etc.) — same pattern. - After Save, the form re-loads it as
••••••••<last4>(masked). To rotate, type the new value over the mask.
Security note: never paste tokens into chat or commit them. They live only in your user row in Postgres — same trust boundary as Tavily/Shodan/SerpAPI keys you already store there.
Discover and add new tools — the Test button
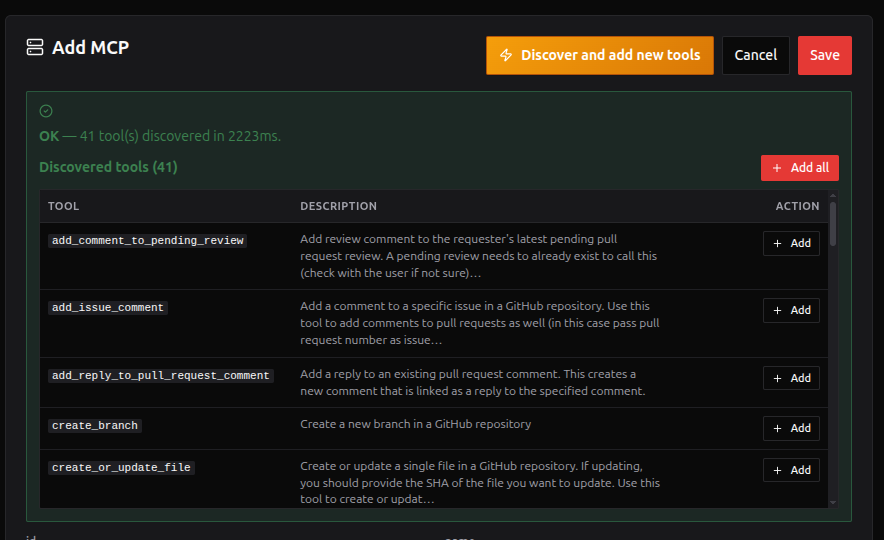
After filling the server connection details (transport + url/command + auth if needed), click the orange Discover and add new tools button at the top right of the form.

What it does:
- Opens a one-off MCP session against your draft (does NOT touch any saved servers or running scans).
- Calls the protocol-level
list_tools()against the upstream MCP. - Returns within 30 seconds with the full list of tools the server exposes — name, description, and JSON input schema for each.
- Renders a scrollable table below.
What the table shows
| Column | Content |
|---|---|
| Tool | The MCP tool name (e.g. search_code, add_issue_comment) |
| Description | The server-provided description, truncated to 160 chars |
| Action | One of: + Add (small button), already added (green tag), reserved (orange tag — name collides with a built-in/system tool) |
+ Add (per-tool import) vs + Add all
- + Add on a single row — imports just that tool into your form's Tools list.
- + Add all at the top — imports every tool that isn't already added or reserved. One click.
Both paths populate all four required strategic fields automatically:
| Field | Populated from |
|---|---|
name | MCP server's tool name |
description | MCP server's full description |
purpose | First sentence of description, truncated to 120 chars |
when_to_use | First sentence of description, truncated to 200 chars (refine for tool-selection accuracy) |
args_format | Auto-derived from the tool's JSON Schema — types, enums, defaults, min/max, format hints, per-property descriptions |
You can hit Save immediately. Or refine when_to_use to make it more strategic (this is the field the LLM weights heaviest when choosing which tool to call).
Test handles auth gracefully: the masked-token placeholder (
••••••••XXXX) is automatically swapped for the real saved token before the test request leaves the browser, so clicking Test on an already-saved server works the same as a freshly-pasted token.
The Tools list — what the LLM sees
Each tool entry has 5 fields, all of which get injected into the agent's system prompt. Hover the → injected in LLM prompt badge on each label for the exact prompt section it lands in.
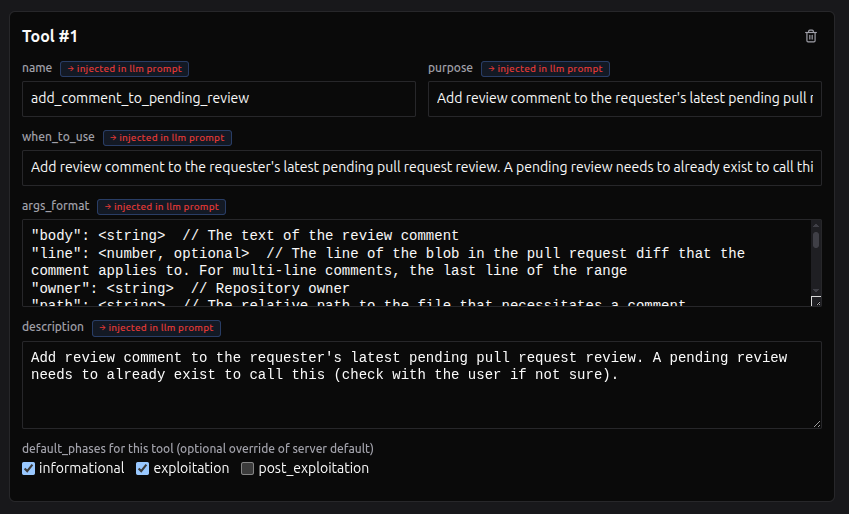
| Field | Where in the prompt | When | Length guidance |
|---|---|---|---|
name | tool_name enum (output schema constraint) | every iteration | identifier-style, lowercase_snake |
purpose | Availability table column 2 | every iteration | ≤ 1 short sentence |
when_to_use | Availability table column 3 | every iteration | strategic / comparative ("use when X, prefer over Y when Z") |
args_format | ### Tool Arguments: section, verbatim | every iteration | JSON-pair style, multi-line OK with // description comments |
description | Detailed-guidance block | every phase where allowed | full operating manual, multi-line OK |
→ injected in LLM prompt badge
Every LLM-bound field has a small blue badge next to its label. Hover for a tooltip that explains exactly which section of the system prompt the field lands in.
Per-tool default_phases override
Below description, each tool has its own 3 phase checkboxes. By default a tool inherits the server's default_phases. Untick any to remove it from that phase only — useful when one tool of a multi-tool server is exploit-only while the rest are recon.
Add Tool Manually
If the server's list_tools() doesn't expose everything (rare) or you want to declare a tool with custom strategic guidance, click + Add Tool Manually in the right side of the Tools section header. A blank tool block appears for you to fill manually.
Saving and what happens next
Click the red Save button at the top of the form. The webapp:
- Re-validates the entire server with zod — strict; rejects half-filled tool specs with field-level errors.
- Performs cross-server uniqueness checks (server
id, tool names) against your existing saved servers. - Persists the row into
UserSettings.mcpServers(a JSON column). - Fires
POST /mcp/reloadagainst the agent (fire-and-forget) so the running agent re-registers the new tools.
You return to the list view. Your new server appears in the saved-servers table with: name, transport pill, tool count, an Enabled toggle, and edit / delete buttons.

What the LLM sees on the next chat message
Within ~1 second of Save, the next chat / scan message you send uses an updated system prompt that includes:
- Each declared tool name in the
tool_nameenum - Each tool's
purpose+when_to_usein the availability table - Each tool's
args_formatin the args reference section - Each tool's
descriptionin the detailed-guidance block (every phase where the tool is allowed)
Verify any time:
curl -s http://localhost:8090/mcp/manifest | python3 -m json.tool
The servers[].tools[] array shows what the agent currently has loaded.
Editing and deleting
Edit
Click the pencil icon in the Actions column. Form opens with all fields populated (auth token masked). Change anything except id. The masked token is preserved if you don't touch it; a fresh value is taken if you type over the mask.
Toggle enabled
The switch in the Enabled column flips immediately — no form needed. A disabled server's tools are removed from the registry on the next reload.
Delete
Click the trash icon → confirmation modal appears (themed, not the browser's gray dialog). Confirm to remove. The agent reloads and the tools disappear from every project's Tool Matrix on next page load.
How it shows up in your projects
Project Tool Matrix
Every project's settings page has a Tool Matrix tab where you toggle each tool on/off per phase. After you add an MCP server here, its tools auto-appear in that matrix — no per-project setup needed.
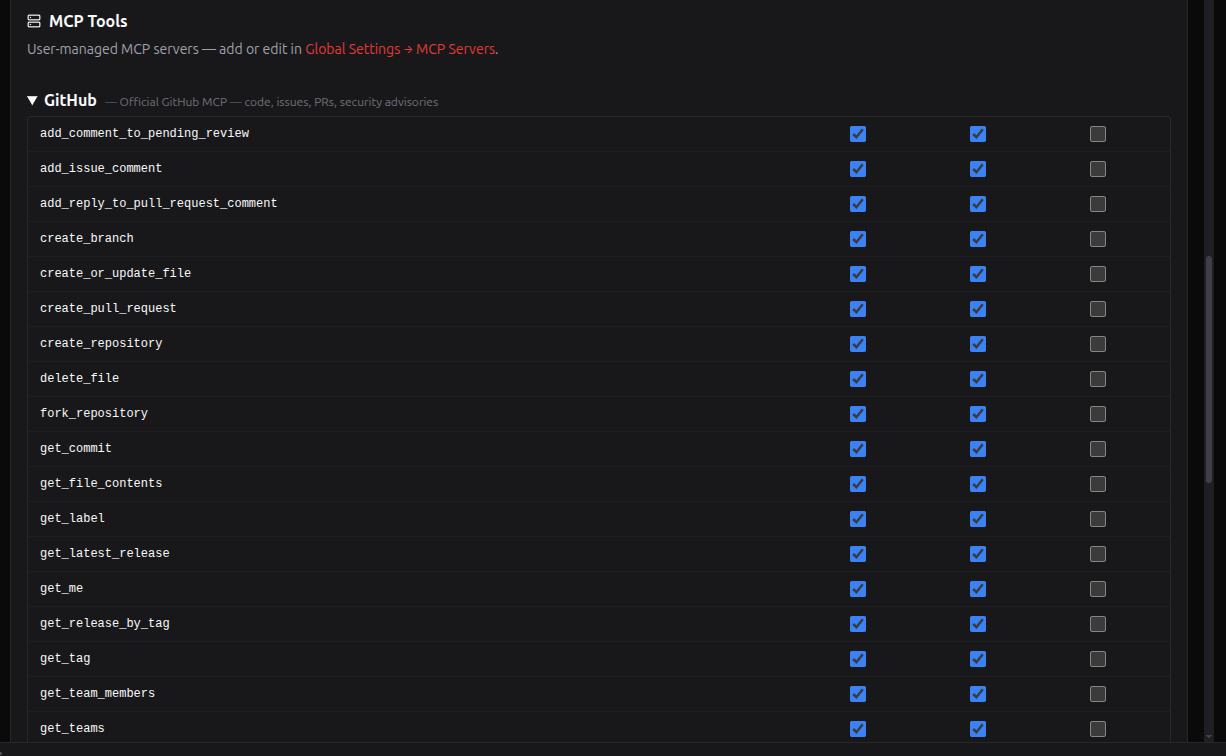
The matrix has two regions:
- Built-in tools — the 25 hardcoded tools (query_graph, web_search, the 18 system MCP-backed tools, etc.) listed flat.
- MCP Tools — a separate section with one collapsible
<details>block per user MCP server you've saved. Tools inherit their default phases until you toggle them.
Agent chat — wrench icon tooltip
The wrench icon next to the phase badge in the agent chat shows a live list of tools available in the current phase.
The tooltip is interactive — hover the wrench, then move your mouse onto the tooltip body to scroll through the full list. Two sections:
- Phase Tools — built-ins + tools you've explicitly toggled in the project's Tool Matrix.
- MCP Tools — user MCP tools whose default phases include the current phase.
The 300-px scroll cap keeps long lists (e.g. 41 GitHub tools) compact.
Recommended testing order
If this is your first time setting up an MCP, work through the presets in this order to build confidence:
- DeepWiki — no auth, just paste and click Test. Confirms the entire pipeline works end-to-end. ~10 seconds.
- Time — stdio, no auth. Confirms the agent's
uvxruntime works for Python stdio MCPs. - GitHub (with a real PAT) — exercises the bearer-token + masked-restore + 41-tool discovery path. Use + add all to see the auto-fill in action across many tools.
- A Threat Intel preset (Shodan, VirusTotal, or HIBP) — confirms env-var auth and that the discovered
args_formatcarries enums + min/max + descriptions through to the prompt. - A complex preset (mitmproxy or Browserbase) — confirms multi-env-var stdio configs.
For each, watch agentic/logs/agent.log for:
INFO orchestrator | MCP manifest reload: N user server(s), M declared tool(s), K live tool(s) registered.
If M > 0 but K == M plus your built-in count, you're good. If K < M, the upstream server didn't expose all tools you declared — check the Test button's discovered list against your Tools list to see the gap.
Example: white-box pentest using the GitHub preset
Once you've added the GitHub preset and clicked + add all in the Test panel to import its ~40 tools, you can drive a full white-box / gray-box pentest from the agent chat. The agent has both the source-side tools (from GitHub MCP) and the live-target tools (execute_curl, execute_playwright, execute_nuclei, metasploit_console, ...) in the same prompt — so it iterates freely between code analysis and live verification.
Two prerequisites:
- The GitHub PAT you saved must have read access to the target repo.
- Turn off the Agent Guardrail toggle in the project's Agent Behaviour settings (this sets
AGENT_GUARDRAIL_ENABLED = false). Otherwise the agent may refuse to use the GitHub tools: the scope reminder injected into its prompt tells it to operate only against the project's configuredtarget_domain/target_ips, andgithub.comis outside that scope. There is no per-repo allowlist to add instead, the scope is keyed on the live target, so the guardrail toggle is the switch to use.
Then drop this prompt into the agent chat — replace <ORG>/<REPO> with the source repo and <TARGET_URL> with the live-target URL already configured in the project:
White-box pentest on the live target.

Source: github.com/<ORG>/<REPO>
Target: <TARGET_URL>

Iterate freely between source analysis and live testing — don't linearize.
Read code with the GitHub tools to form hypotheses, then verify each
hypothesis against the live target with the existing pentest tools.
Whatever you find on the live side, go back to the code to understand
why and find adjacent variants.

Persist findings in the graph as you go. Stop when coverage plateaus.
What you'll see in the timeline:
search_codecalls with attacker-pattern queries (SELECT.*FROM.*\$,eval(,dangerouslySetInnerHTML, hardcoded secret regex, etc.) — fast, surgical, low token cost.get_file_contentscalls when a hit needs context.execute_curl/execute_playwright/execute_nucleicalls verifying each candidate against the live target.query_graphupdates as confirmed findings becomeVulnerabilitynodes.
The same prompt-shape works for any source-aware MCP — swap in GitLab MCP or your internal code-search MCP the same way.
Note: this is freeform white-box mode driven by your prompt. A dedicated
white_box_auditskill (under Agent Skills) with a curated 5-phase methodology is a natural follow-up if you find yourself running this regularly.
Troubleshooting
| Symptom | Cause + Fix |
|---|---|
| Test → "Failed: ExceptionGroup..." | Generic transport error. The agent now unwraps it on stdout — check the agent logs for the specific cause (DNS, 401, refused connection). |
| Test → "Failed: schema validation failed" | A tool spec has an empty required field. The Test button strips half-empty rows automatically; if you still see this, check that all 4 strategic fields per tool are filled. |
| Test on saved server → "401 Unauthorized" | Your saved token is wrong / expired. Type a new value over the masked placeholder and Test again. |
| Test → "UnicodeEncodeError" | Should not happen anymore. If it does, your auth token contains non-ASCII chars — paste a fresh token. |
agent_tool_phase_map orphaned keys after deletion | When you delete an MCP server with tools, the project's per-tool phase overrides for those tools stay in the DB but are hidden in the UI. They self-heal if you re-add the server with the same id. No action needed. |
| stdio MCP doesn't start | The command binary must exist in the agent container. uvx (Python ecosystem) and npx (Node) are both pre-installed. Anything else needs an agent-image rebuild. |
| Reload didn't fire after save | The webapp's fire-and-forget POST to /mcp/reload is best-effort. Hit POST http://localhost:8090/mcp/reload manually from a terminal as a fallback. |
Validation rules cheat sheet
zod (form / API route) and pydantic (agent) enforce identical rules — these will reject saves:
idmust match^[a-zA-Z0-9_][a-zA-Z0-9_-]*$and not collide with the 5 system server IDs.- Tool names must not collide with built-in tool names (
query_graph,execute_nmap,kali_shell, etc.) or with another tool name across your saved servers. - HTTP transports require a non-empty
url. stdio requires a non-emptycommand. - All four tool fields (
name,purpose,when_to_use,args_format,description) must be non-empty. auth(when present) must specify eithertoken(literal) ortoken_env_var(env var name) — at least one.
Cross-server uniqueness is enforced after individual schemas pass.
Storage & security model
- Where it lives:
UserSettings.mcpServersJSONB column in Postgres. Same trust boundary as your other API keys (tavilyApiKey,shodanApiKey). - Token at rest: stored as plaintext in the DB — same trust boundary as your other API keys (Tavily / Shodan / SerpAPI). Headers and stdio env values are also stored as literal strings; no
${VAR}substitution is performed. - Token in transit (within the stack): webapp → agent over the internal Docker network only. Never serialized into log lines.
- Token at the boundary: the agent forwards it as
Authorization: Bearer <token>verbatim when calling the upstream MCP. - Display: API responses always mask the token (
••••••••<last4>). The mask never reaches the upstream MCP — the proxy substitutes it back from DB before forwarding. - Defense in depth: the agent rejects bearer tokens containing non-ASCII chars (catches the masked placeholder ever leaking through, returns a clean error instead of crashing httpx).
See also
- AI Agent Guide — chat interface, agent phases, where MCP tools surface in the timeline.
- Global Settings — full Global Settings reference. The MCP Tool Plugins tab is one of seven; LLM Providers and API Keys live next door.
- Project Settings Reference — every project parameter, including the Tool Matrix
agentToolPhaseMapJSON column that user MCP tools surface in. - Agent Skills — built-in workflows (CVE exploit, brute force, phishing) that use built-in tools. MCP tools complement skills — the LLM sees both in the same prompt.
- docs/readmes/README.MCP.md — protocol-level architecture, schema, and runtime tool dispatch internals.