
CypherFix — Automated Vulnerability Remediation
CypherFix is RedAmon's automated remediation pipeline. One triage run scores every vulnerability, CVE, secret and attack-chain finding in your Neo4j graph, groups the ones that share a fix, and writes one fix item per group. A second AI agent then clones your repository, implements the fix, and opens a pull request, all from within the RedAmon interface.
The same run produces the Priority Board's order, so the board and the fix list always agree. The scoring and the grouping are done in code and need no AI key at all.
CypherFix and the Priority Board are two views of one run
They are not two features that happen to agree. One button, on either page, runs one job, and each page shows a different half of its result.
| Priority Board | CypherFix | |
|---|---|---|
| Answers | What should I deal with first? | What do I actually change? |
| A row is | one finding | one group of findings that share a fix |
| Shows | score, tier, the four factors, the AI's verdict and quote | the fix, its diff, and the pull request |
| You act by | Real / False positive / Mute | Start CodeFix, approve a diff, dismiss |
Because a fix item is a group, one CypherFix row can clear many board rows at once: one dependency upgrade closing sixty-eight advisories is normal. Each fix item carries the group's priority score, so the fix list is in the board's order.
For what every board column and value means, see Reading the board.
Table of Contents
- Prerequisites
- Configuring CypherFix Settings
- Step 1: Starting Vulnerability Triage
- Step 2: Understanding the Triage Progress
- Step 3: Browsing the Remediation Dashboard
- Step 4: Viewing Remediation Details
- Step 5: Starting the CodeFix Agent
- Step 6: The Activity Log
- Step 7: Reviewing Diff Blocks
- Step 8: Pull Request Creation
- Remediation Lifecycle
- Remediation Types
- Re-running Triage
- Troubleshooting
Prerequisites
Before using CypherFix you need:
- Reconnaissance data — run at least one reconnaissance scan so the graph contains vulnerabilities, CVEs, and other findings for the triage agent to analyze
- A GitHub repository with the source code of the target application (or the project you want fixes applied to)
- A GitHub Personal Access Token with
reposcope — needed for cloning, pushing branches, and creating pull requests - An LLM provider in Global Settings, and two models chosen for your account in Global Settings → LLM Providers → Models by feature: CodeFix, and Triage review if triage runs review findings. Each is asked for the first time it is needed, and neither falls back to the agent's model
Configuring CypherFix Settings
Navigate to Project Settings and open the CypherFix Settings tab (Tab 12).
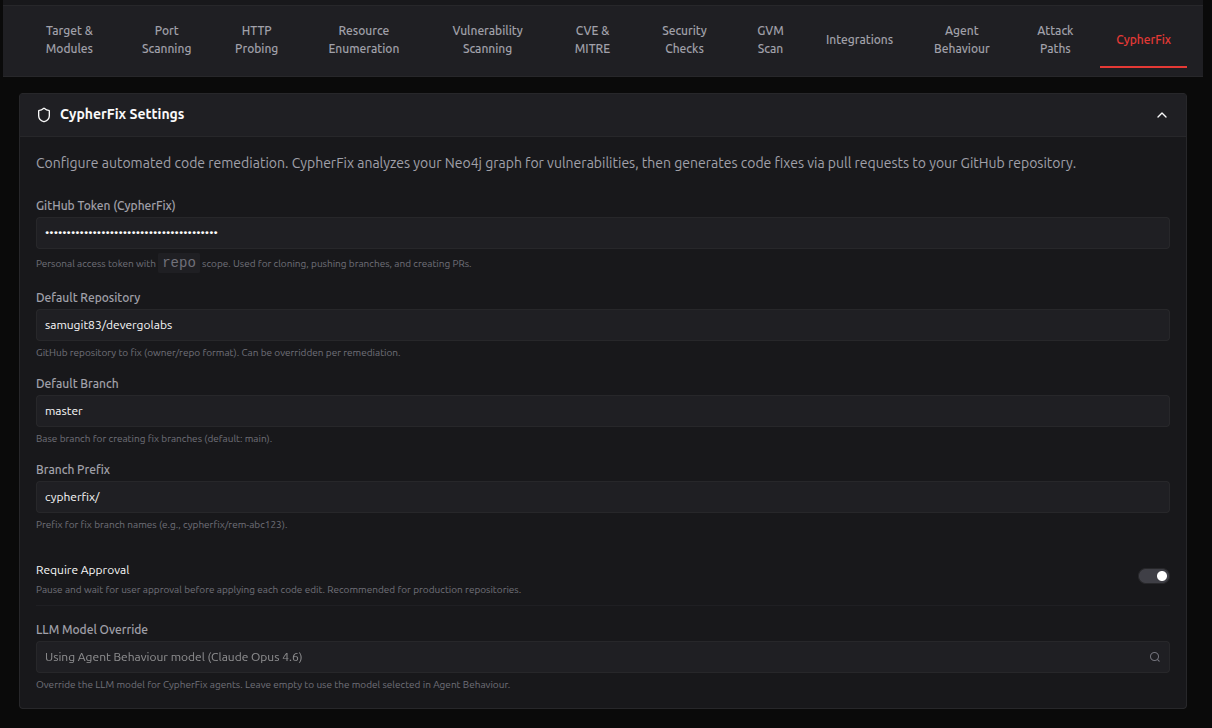
Required Settings
| Setting | Example | Description |
|---|---|---|
| GitHub Token | ghp_xxxxxxxxxxxx | Personal Access Token with repo scope for cloning and pushing |
| Default Repository | myorg/myapp | Target repository in owner/repo format |
| Default Branch | main | Base branch the agent creates fix branches from |
| Branch Prefix | cypherfix/ | Prefix for auto-created fix branches (e.g., cypherfix/fix-sqli-42) |
Optional Settings
| Setting | Default | Description |
|---|---|---|
| Require Approval | On | Pause before each code edit so you can review and accept or reject it. Recommended for production repositories |
| Triage review model | (not set) | The model that reviews the top findings' evidence and words the fix list. Yours, not this project's: the same setting as Global Settings → LLM Providers → Models by feature, used in all your projects, and saved as soon as you pick it. Needed only when Priority Board: findings the AI reviews is above 0 |
| CodeFix model | (not set) | The model the CodeFix agent runs on. Account-wide like the one above. It needs a strong model that supports tool calls, and CodeFix does not start without it |
| Priority Board: findings the AI reviews | 150 | How many findings a triage run reviews with the AI. 0 ranks every finding with no AI review and needs no Triage review model |
There is no per-project CypherFix model: both models belong to your account, and triage and CodeFix run on the project owner's models and keys. A CypherFix model saved on a project before this change is ignored.
Important: If any required setting is missing, the CodeFix button on remediation details will be disabled with an alert listing exactly which fields need to be filled in.
Creating a GitHub Personal Access Token
- Go to GitHub → Settings → Developer settings → Personal access tokens → Tokens (classic)
- Click Generate new token (classic)
- Give it a descriptive name (e.g., "RedAmon CypherFix")
- Select the
reposcope (full control of private repositories) - Click Generate token and copy the
ghp_...value - Paste it into the GitHub Token field in CypherFix Settings
Step 1: Starting Vulnerability Triage
- Open the Red Zone for your project
- Click the CypherFix tab in the view tabs at the top
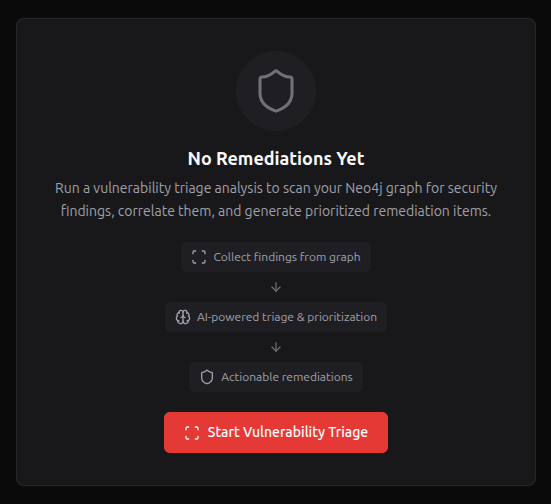
- If no fix items exist yet, you'll see the Empty State screen with a three-step visual: score every finding, group by fix, one fix item per group
- Click Start Triage
A dialog appears first, with this project's own numbers in it: how many findings are in scope and how many are new since the last run, when the last run was and with which model, roughly how many AI calls this one will cost, and how many fix items are pending or already being worked on. If something is blocking a run (a version activation, or another run already going) it says so and the button is disabled.
If the run would review findings and you have no Triage review model yet, the model picker opens before the dialog. Once you pick one, the dialog names it as the model that will review. With Priority Board: findings the AI reviews at 0, no model is asked for.
The same button, with the same dialog, is on the Priority Board. It is one job: whichever page you start it from, both update.
Step 2: Understanding the Triage Progress
A modal overlay appears showing real-time triage progress:
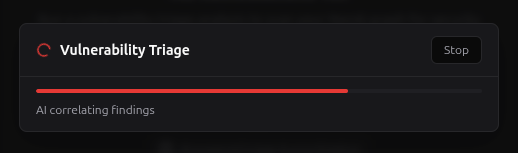
Triage Phases
One run. Only the last step writes findings.
| Phase | What happens | AI? |
|---|---|---|
| Authorizing | Checks the project is yours, that no version activation is in progress, and that no other run is already going. Nothing is read until this passes | no |
| Scoring | Reads the project's facts once (which hosts are live, which ports an active scan found, which packages are actually served, what the agent proved), then one row per finding, and scores each out of 100 | no |
| Grouping | Findings that share a fix become one group: one CVE on three hosts, or every advisory on one package | no |
| Reviewing (n/N) | The model reads the evidence behind each finding it can judge that has no still-valid review, and corrects the four factors. Every quote it gives is checked | yes |
| Writing fix items (n/N) | One item per group, in the same order as the board. The fields are computed; only the wording comes from the model | yes |
| Publishing | The ranking is written to the graph and the fix list is upserted, both at once | no |
Nothing is written until Publishing. Stop a run before then and your previous ranking and fix list are exactly as they were. Once it is publishing, Stop is refused: stopping halfway would leave the board and the fix list disagreeing.
Runs can also start over MCP. An external agent holding one of your access
tokens with the opt-in triage:run permission can start or stop a run; the
dashboard then shows Started over MCP · rdmn_mcp_…. Runs an agent starts are
spaced 30 minutes apart per project, capped at 12 a day, and review at most 1,000
findings. See Priority Board: Triage from an external agent.
The CypherFix page shows a run started anywhere else as soon as you open it.
Findings the model cannot usefully judge never reach it: a missing security header is a fact, and a dependency advisory's evidence is the advisory text rather than anything about your target. On a real project that is most of the graph, which is where the cost would otherwise go.
A review lasts while its evidence is unchanged, so a later run keeps it and it costs nothing.
Where a fix item's text comes from. A fix item's solution and evidence come from the built-in AI's review only. An external agent's review over MCP can move a finding's score, but its text never reaches a fix item, and so never reaches the CodeFix agent. And an agent's false positive keeps its finding in the fix group: only your own False positive, or the built-in review's, takes a finding out of its fix item.
What You See During Triage
- Progress bar — fills as phases complete (0-100%)
- Phase label — name of the current phase (e.g., "Collecting CVE Chains")
- Thinking section — shows the AI's reasoning in real-time (last 200 characters visible)
- Live findings — the last 6 findings appear with severity badges as they're generated
Controls
| Button | Action |
|---|---|
| Stop | Aborts the triage immediately |
| Close | Hides the modal (triage continues running in the background) |
| View Dashboard | Appears when triage completes; navigates to the remediation dashboard |
Step 3: Browsing the Remediation Dashboard
After triage completes, the dashboard shows all generated remediations sorted by priority:
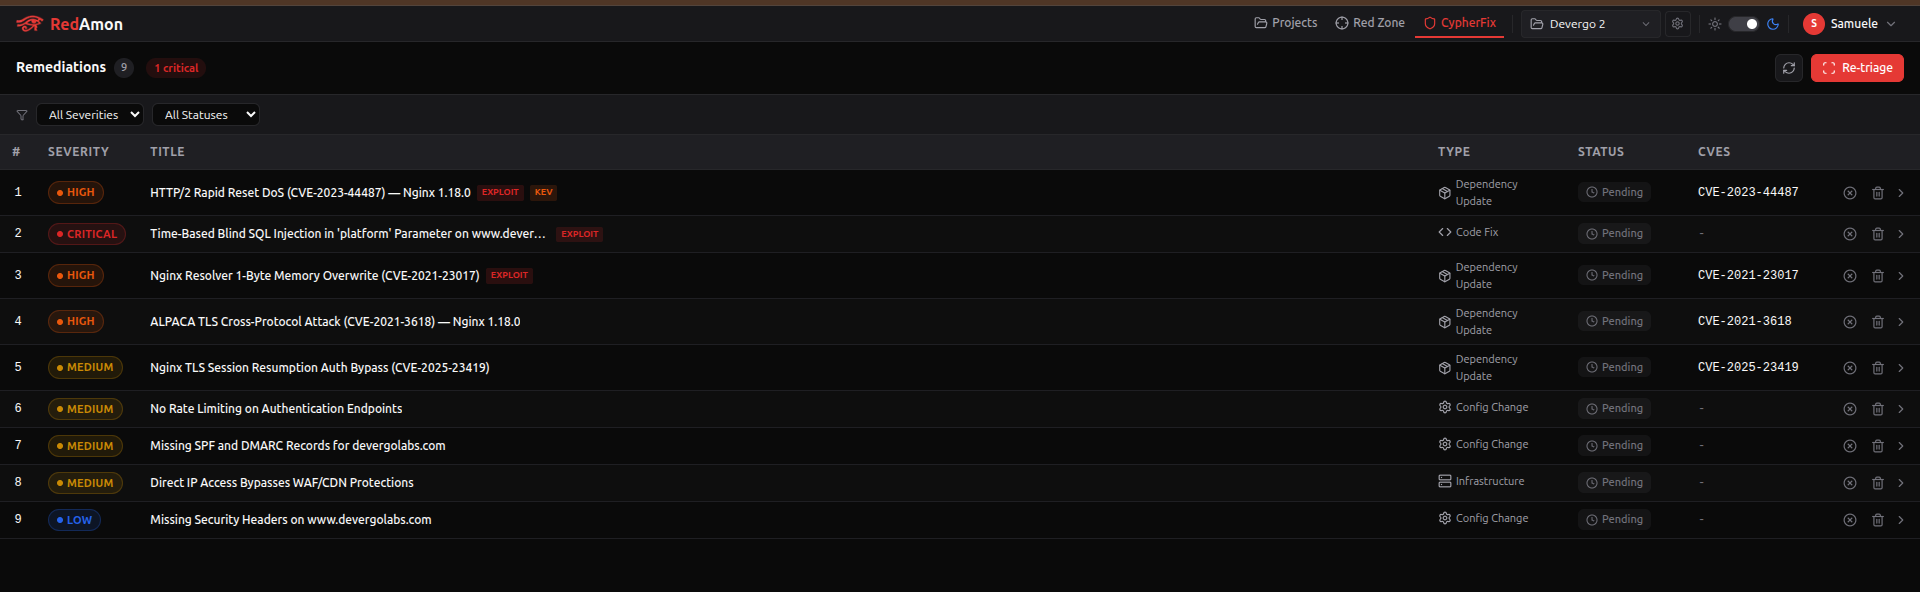
Dashboard Header
- Total count badge next to the "Remediations" title
- Critical count badge (red) if any critical-severity items exist
- Refresh button to reload data from the server
- Re-triage button to run a new triage analysis
Filtering
Two dropdown filters at the top of the table:
- Severity — All Severities, Critical, High, Medium, Low, Info
- Status — All Statuses, Pending, In Progress, No Fix, Code Review, PR Created, Resolved, Dismissed
A Clear button appears when any filter is active.
Remediations Table
Sorted by priority (highest first), then by severity. Each row shows:
| Column | Description |
|---|---|
| # | Priority rank number |
| Severity | Color-coded badge: Critical (red), High (orange), Medium (yellow), Low (blue), Info (gray) |
| Title | Vulnerability title. May include "Exploit Available" or "CISA KEV" tags |
| Type | Remediation type icon (code fix, dependency update, config change, secret rotation, infrastructure) |
| Status | Status badge with icon: Pending (clock), In Progress (play), No Fix (alert), Code Review (eye), PR Created (git), Resolved (check), Dismissed (x) |
| CVEs | Associated CVE identifiers |
| Actions | Dismiss and Delete buttons |
Row Actions
- Click a row — opens the full remediation detail view
- Dismiss — marks the remediation as dismissed (only available for pending items)
- Delete — permanently removes the remediation from the database
Step 4: Viewing Remediation Details
Click any row in the dashboard to see the full remediation detail:
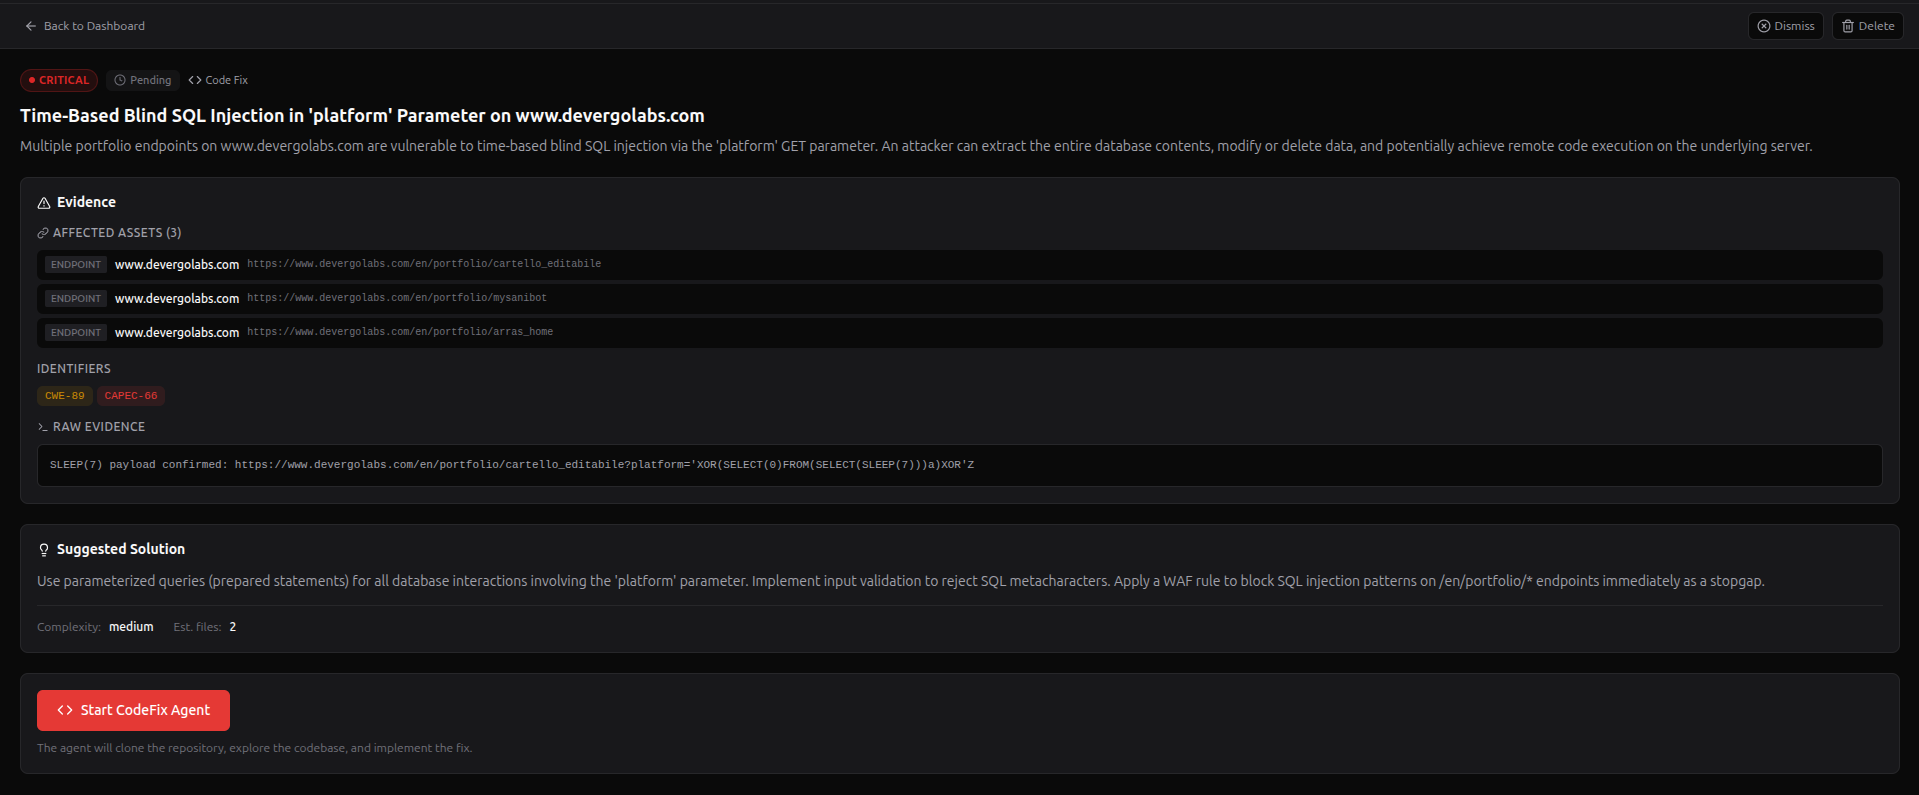
Header
- Badges — severity, status, remediation type, CVSS score (if available)
- Title — full remediation title
- Description — detailed description of the vulnerability and its impact
Evidence Section
- Affected Assets — collapsible list showing asset type (package, host, URL), name, and address
- Identifiers — clickable tags for CVE IDs (blue), CWE IDs (orange), and CAPEC IDs (purple)
- Raw Evidence — code block with terminal output, matched URLs, curl commands, or nuclei results
- Attack Chain Path — if the vulnerability was confirmed through an attack chain, shows the graph path
Solution Section
- Suggested Solution — markdown-rendered remediation guidance with specific, actionable steps
- Fix Complexity — estimated difficulty: low, medium, high, or critical
- Estimated Files — how many files the fix is expected to touch
CodeFix Section
At the bottom of the detail view, the CodeFix section shows one of these states:
| State | What You See |
|---|---|
| Ready | "Start CodeFix Agent" button enabled, with a note about what the agent will do |
| Missing settings | Yellow alert listing which CypherFix settings need to be configured. Button disabled |
| Manual only | Message explaining this remediation type (e.g., secret rotation) requires manual intervention |
| Already has PR | Link to view the existing pull request on GitHub |
| In progress | "CodeFix in Progress..." with disabled button |
| Failed previously | Agent error message with a "Retry CodeFix Agent" button |
Navigation
- Back to Dashboard button (top-left) returns to the remediations list
- Dismiss and Delete buttons available in the top-right
Step 5: Starting the CodeFix Agent
- From the remediation detail view, click "Start CodeFix Agent"
- You'll be taken to the DiffViewer — a full-screen activity log view
The first time, before anything starts, you are asked to choose your CodeFix model; it is saved to your account (Models by feature). CodeFix never starts without one, and never on a default. Choose a strong model that supports tool calls: the agent works entirely through the tools listed below. If the provider refuses the model, Your model X could not be used appears and the picker opens again.

The CodeFix agent performs these steps automatically:
- Clones your repository (the configured default repo and branch)
- Explores the codebase — reads files, searches for relevant code, maps the repository structure
- Plans the fix — generates a fix plan with the list of files to modify and the approach
- Implements changes file by file — each edit produces a diff block for your review
- Verifies the fix — runs basic checks to ensure the code compiles
- Commits, pushes, and opens a PR on GitHub
Header Controls
| Control | Description |
|---|---|
| Back (arrow) | Returns to the remediation detail view. Does not stop the agent |
| Stats | Shows "X accepted, Y rejected, Z pending" for diff blocks |
| Stop | Halts the agent immediately |
Step 6: The Activity Log
The activity log is a chronological stream of everything the CodeFix agent does — similar to watching a developer work in real-time:
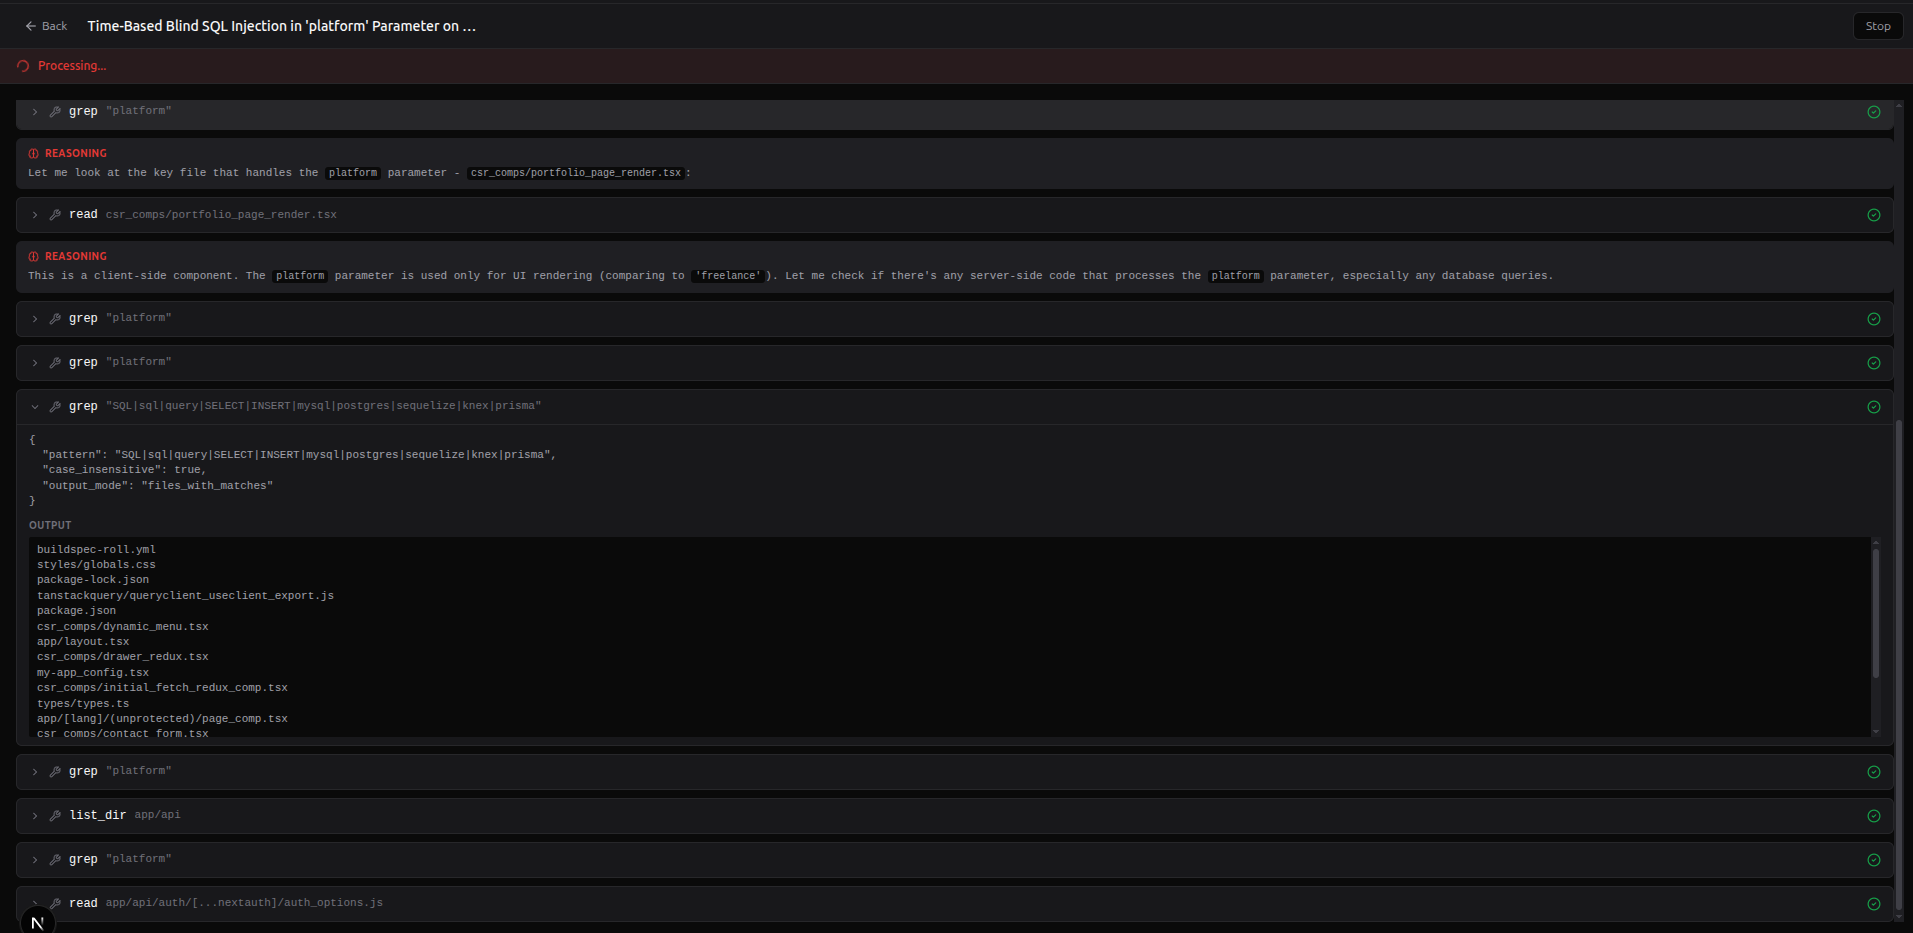
Entry Types
| Icon | Type | Description |
|---|---|---|
| — | Phase | Horizontal separator showing the current phase (e.g., "Cloning Repository", "Exploring Codebase", "Implementing Fix") |
| Brain | Thinking | The AI's reasoning text. Collapsible — click "Show more" for long reasoning blocks |
| Wrench | Tool Call | A tool execution (e.g., github_read src/auth.ts). Shows a spinner while running, then the output when done. Click to expand/collapse |
| Clipboard | Fix Plan | The agent's planned approach: a description of what will change and a list of files to modify or create. Expanded by default |
| File | Diff Block | A proposed code change requiring your review. See Step 7 |
| Git merge | PR Created | Link to the created pull request with title and file change stats |
| Alert | Error | Error message if something goes wrong |
| Checkmark | Complete | "CodeFix completed" confirmation |
Auto-Scroll Behavior
- The log auto-scrolls to the bottom as new entries appear
- If you scroll up to review earlier entries, auto-scroll pauses
- Scrolling back to the bottom resumes auto-scroll
CodeFix Agent Tools
The agent has 11 tools for exploring and modifying the cloned repository:
| Tool | Purpose |
|---|---|
github_glob | Find files by glob pattern (e.g., **/*.ts, src/**/*.py) |
github_grep | Search file contents with regex |
github_read | Read a file's full contents |
github_edit | Edit a file — produces a diff block for approval |
github_write | Create a new file — produces a diff block for approval |
github_bash | Run build/test commands in the cloned repo (e.g., npm install, go build) — executed inside an isolated sandbox (see below) |
github_list_dir | List directory contents |
github_symbols | Search for code symbols (functions, classes, variables) |
github_find_definition | Find where a symbol is defined |
github_find_references | Find all references to a symbol across the codebase |
github_repo_map | Get a high-level repository structure overview |
Security: builds run in an isolated sandbox
Because CodeFix clones and builds your repositories — which can contain attacker-influenced content (a malicious postinstall script, a prompt-injected README) — every build/test command (github_bash) runs inside a dedicated, locked-down sandbox container, not inside RedAmon's agent:
- The sandbox is spawned fresh for each remediation and destroyed afterwards.
- It holds no RedAmon secrets and cannot reach RedAmon's internal services (it has internet access only, so dependency installs still work).
- It runs non-root with all Linux capabilities dropped, a read-only filesystem, and CPU/memory limits.
- Your GitHub token never enters the sandbox — cloning, committing, and pushing happen outside it.
- Commits include only the files the agent edited and you approved (build artifacts and any files a build slips in are excluded), and the agent will refuse to push to your default branch /
main/master.
This requires the sandbox image to be built once: docker compose --profile tools build codefix-sandbox. If it is missing, github_bash is disabled (the agent can still read and edit files) rather than running unsandboxed.
Step 7: Reviewing Diff Blocks
When the agent proposes a code change (via github_edit or github_write), a diff block appears inline in the activity log:
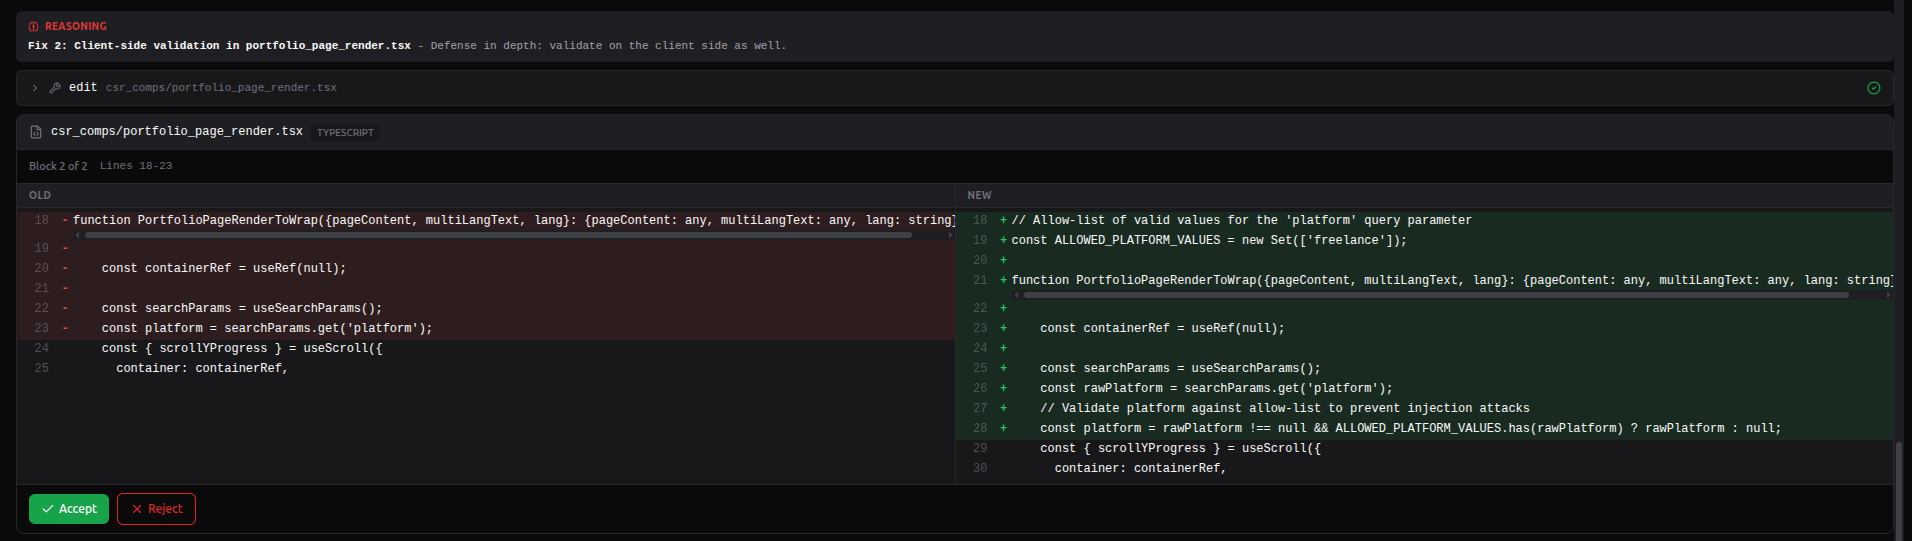
Diff Block Layout
- File header — filename and detected programming language
- Block info — block number (e.g., "Block 1 of 5"), affected line range, description of the change
- Split diff view — side-by-side comparison:
- Left pane (OLD) — original code with removed lines highlighted in red
- Right pane (NEW) — modified code with added lines highlighted in green
- Gray lines show unchanged context
- Action buttons — Accept or Reject
Accepting a Block
Click Accept (checkmark icon). The block is marked as accepted and the agent continues to the next step.
Rejecting a Block
- Click Reject (X icon)
- An input field appears where you can type an optional rejection reason (e.g., "Use parameterized queries instead of string escaping")
- Click Reject again to confirm, or Cancel to go back
- The agent receives your rejection reason and adjusts its approach accordingly
Tip: If Require Approval is enabled in settings, the agent waits for your decision on each block before proceeding. If disabled, blocks auto-accept after a 5-minute timeout.
Block Statuses
| Status | Meaning |
|---|---|
| Pending | Awaiting your decision |
| Accepted | You approved the change — it will be included in the commit |
| Rejected | You rejected the change — the agent may try an alternative approach |
Step 8: Pull Request Creation
After all diff blocks are processed, the agent:
- Commits all accepted changes with a descriptive commit message
- Pushes to a new branch using the configured prefix (e.g.,
cypherfix/fix-sql-injection-42) - Opens a pull request on GitHub targeting the default branch

The PR entry in the activity log shows:
- PR title — descriptive title summarizing the fix
- File stats — number of files changed, lines added and removed
- View PR button — opens the pull request on GitHub in a new tab
The remediation status automatically updates to PR Created, and the remediation detail view will show a direct link to the PR on GitHub.
Remediation Lifecycle
Each remediation follows this lifecycle:
pending
├── Start CodeFix → in_progress
├── Dismiss → dismissed
└── Delete → (removed)

in_progress
├── Agent succeeds → pr_created
├── Agent fails → no_fix
└── Stop agent → pending

no_fix
├── Retry CodeFix → in_progress
├── Dismiss → dismissed
└── Delete → (removed)

pr_created
├── View PR on GitHub
├── Mark as resolved → resolved
└── Delete → (removed)

code_review
├── Mark as resolved → resolved
└── Dismiss → dismissed

resolved (final state)

dismissed (final state)
Remediation Types
Not all remediations can be handled by the CodeFix agent:
| Type | Agent Support | Description |
|---|---|---|
| Code Fix | Yes | Source code changes (e.g., fix SQL injection, add input validation, patch XSS) |
| Dependency Update | Yes | Update vulnerable packages in package.json, requirements.txt, go.mod, etc. |
| Config Change | Yes | Modify configuration files (nginx.conf, Apache configs, app settings) |
| Secret Rotation | No | Requires manual rotation of leaked credentials and API keys |
| Infrastructure | No | Requires infrastructure-level changes (firewall rules, network configuration, cloud settings) |
For remediation types that require manual intervention, the detail view displays an informational message instead of the CodeFix button.
Re-running Triage
You can re-run triage at any time to pick up new findings:
- From the dashboard header, the Re-triage button
- From the empty state, the Start Triage button
- From the Priority Board toolbar, the same button again
When to re-run triage:
- After running a new reconnaissance scan that discovered additional vulnerabilities
- After a GVM scan completes with new network-level findings
- After running attack chains that produced new exploit confirmations
- After updating the target application and wanting to verify fixes
The triage agent is smart enough to skip issues that already have existing remediations, avoiding duplicates.
A finding's review is kept while its evidence is unchanged. After you switch the Triage review model, the next run reviews the built-in AI's reviews again, once; an external agent's review is never re-reviewed by a run.
Muted findings leave triage. At the next run, a fix item whose findings are all muted is removed if nobody has touched it, or kept with no live findings if someone owns it. Multi mute says how many fix items will update when you close it.
Troubleshooting
CodeFix button is disabled
Cause: Missing required CypherFix settings.
Fix: Go to Project Settings → CypherFix Settings tab. The alert below the button lists exactly which fields are missing (GitHub Token, Default Repository, Default Branch, or Branch Prefix).
Triage finds no remediations
Cause: The Neo4j graph has no vulnerability data.
Fix: Run at least one reconnaissance scan first. The triage agent queries the graph for vulnerabilities, CVEs, secrets, and security check results. If none exist, there's nothing to triage.
Agent fails with "authentication error"
Cause: GitHub token is expired, revoked, or lacks the required repo scope.
Fix: Generate a new Personal Access Token at GitHub → Settings → Developer Settings → Personal Access Tokens → Tokens (classic). Make sure to select the repo scope.
Agent fails with "repository not found"
Cause: Incorrect repository format or insufficient permissions.
Fix: Check that the Default Repository setting uses the exact owner/repo format (e.g., myorg/myapp, not just myapp). Verify your token has access to that repository (especially for private repos).
Diff blocks time out
Cause: If "Require Approval" is enabled, the agent waits for your accept/reject decision on each block. Blocks auto-accept after 5 minutes if you don't respond.
Fix: Keep the DiffViewer tab active while the agent runs. If you need to step away, consider disabling "Require Approval" in settings for automated runs.
Agent produces incorrect fix
Cause: The AI may misunderstand the codebase structure or the correct fix approach.
Fix: Reject the diff block and provide a descriptive reason (e.g., "Use prepared statements instead of input escaping"). The agent reads your feedback and attempts an alternative approach. You can also stop the agent and retry with more specific guidance.